Обзор учебного курса
Заметки учителя становятся презентацией на 10 слайдов. Каждое число ведёт к заметкам.
Записано 2026-10-20 · В этом примере потрачено 31 кредит · новым аккаунтам — 20 бесплатных кредитов
Запрос
Using the attached course draft, make a course design overview for the curriculum committee to review. Stick to the draft; don't add outside facts or figures. 10 slides, with the support needed and the budget on the last slide.
- data-literacy-101-course-draft.docx
По шагам
Запрос
Опишите презентацию на главной странице и приложите материалы.
Поиск
ИИ ищет информацию (источников: 5) и задаёт несколько вопросов о запросе, рекомендуемые ответы уже выбраны. Вопросы можно пропустить.
План
План приходит по карточкам: заголовок, ключевые пункты и макет для каждого слайда. Карточки можно править, удалять, добавлять или попросить ИИ переписать одну. План бесплатный.
Настройки
Затем выберите оформление и способ создания: быстрый режим — 1 кредит за слайд, глубокий — 3 кредита. Здесь глубокий режим: 10 слайдов × 3 = 30 кредитов.
Создание
Слайды появляются один за другим. На деле это заняло 54 с; здесь ускорено.
Нажмите на число на слайде, чтобы увидеть, откуда оно. В заметках нет бюджета, поэтому в презентации стоит «уточнить», а не выдуманная сумма.
Правка ИИ
Одна фраза для ИИ: «Make the course goals on slide 5 more specific: start each one with "By the end of the course, students can".» Изменённое подсвечивается. Правка с ИИ стоит 1 кредит; если ничего не изменилось, кредит возвращается.
Экспорт
Экспортируйте редактируемый PPTX или PDF. Экспорт бесплатный, этот пример можно скачать.
Слайды
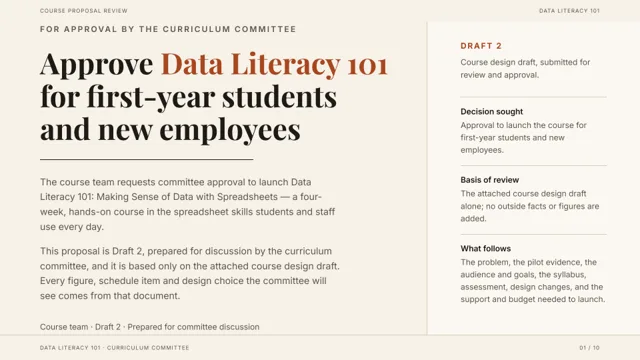
- Approve Data Literacy 101 for first-year students and new employees
- Course team requests committee approval to launch the course
- Draft 2, prepared for discussion by the curriculum committee
- Proposal is based only on the attached course design draft
- Students and staff handle data daily but were never taught how
- First-year students and new employees must organize and read spreadsheets for reports and weekly updates
- Data sits in several files and is copied by hand
- Charts get made, but nobody can say what they show
- The course covers only everyday spreadsheet skills: no programming, no statistics theory
- The campus pilot showed strong engagement and demand
- 21 of 24 participants completed every exercise in last fall's campus pilot
- Session 5 on pivot tables was the favorite in the end-of-course survey
- Audience: first-year students or first-year employees, no prerequisites
- Open to first-year university students or employees in their first year on the job
- Class size: about 30 people
- Prerequisite: basic computer skills only, no programming experience needed
- Three goals: clean data, answer questions, present one finding
- Turn messy raw data into a clean, well-structured table
- Answer specific questions with sorting, filtering, subtotals and pivot tables
- Pick the right chart and explain one finding with a one-page chart
- Four weeks, eight hands-on sessions building skill step by step
- 4 weeks, 2 sessions a week, 90 minutes each: 8 sessions in total
- Sessions 1-2: understanding data and cleaning a messy table
- Sessions 3-5: sorting, filtering, common functions, subtotals and pivot tables
- Sessions 6-7: choosing charts and writing a one-chart data brief
- Session 8: final group presentations and feedback
- Every session: short demo, then most time hands-on
- 20 minutes of explanation and demo at the start
- 60 minutes of hands-on practice, with instructor and teaching assistant walking around to help
- 10 minutes to wrap up and set the week's exercise
- All practice data is made-up sample data; no real personal information is used
- Grading: exercises and final report carry the weight
- Attendance: 10%
- Weekly exercises: 40%, four exercises at 10% each, due before the next session
- Final group report: 50%, split into content 30% and presentation 20%
- Final report: groups of 3-4, a brief of no more than 5 pages, 8-minute presentation plus 4 minutes of questions
- Pilot feedback drove four concrete design changes
- Session 4 functions were split: four must-know taught in class, optional ones moved to the cheat sheet
- Practice files now include duplicate rows, blanks and mixed date formats on purpose
- Final presentations extended from 6 to 8 minutes, plus 4 minutes for questions
- Every handout now ends with a summary page and one self-check question
- Approve to launch; support and budget items listed below
- Support needed: a teaching assistant in every session to help answer questions
- Support needed: class list one week before the course starts, so groups can be set up in advance
- Resources: any spreadsheet app, 8 instructor-prepared practice datasets, session handouts and a function cheat sheet
- Budget: not specified in the draft (TBD), to be confirmed with the committee
Вот и весь процесс
Сделайте презентацию на свою тему: войдите через Google, и запрос из примера будет ждать на главной, чтобы вы его изменили и отправили.
Сделать на свою тему Скачать PPTX Скачать PDF
Другие примеры: План запуска продукта · Доработка готового PPTX