How do I make a budget presentation with AI?
Updated 2026-11-09
A budget presentation works best when the first slide gives the total you are asking for and the decision you need, and the following slides show where the money goes, what it buys, how it compares with last year, and what happens if you get less. Eight to ten slides is common; the full line-by-line budget stays in the spreadsheet.
To build it with Gamma AI Slide, attach your budget workbook (Excel) or a document that describes it, write the slides you want, check the outline cards, and generate. You get an editable PowerPoint (.pptx). Writing the outline is free; a quick-mode slide is 1 credit, so a 9-slide deck is 9 credits.
One limit up front: a table slide holds at most 6 rows and 5 columns, so a budget with 30 lines must be grouped into five or six categories. The product also does not do your arithmetic: work out the totals in Excel first. We have no recorded budget deck; the picture is a different real slide with a table, and the example budget is made up.
Six steps from a budget sheet to budget slides
Group the budget and check the totals in Excel
Roll the lines up into five or six categories (people, software, programs, travel, contingency) and make sure the totals add up before you attach anything. Add columns for last year, this year’s request and the change; put the currency and unit in the header (“USD thousands”).
Attach a short summary sheet, not the ledger: a sheet of more than 2,000 rows is read summed by month or category before the AI sees it, and the sources panel says so.
Write one paragraph on what the money buys
For each category, one line on the result it pays for (“two more support engineers: first reply time from 9 h to 4 h”). A budget slide without outcomes invites the question “why so much?”. Put these lines in a Word file or on a second sheet, and attach it with the workbook.
Write the request and attach the files
On the home page, click “Add files” (each up to 25 MB), attach the workbook and the notes, and paste the request below with your slide plan. Click “Next” and choose “Quick mode” (1 credit per slide).
Set scenario, audience and detail
Under “More”, set the scenario to “Proposal” and the audience to “Executives” (or “Clients” for a customer budget). Tone “Persuasive” if you are asking for money, “Rigorous” if you are reporting. “Text per slide” at “Concise” keeps the numbers visible.
Pick the layout on each outline card
Choose “Key figures” for the total and two or three headline numbers (2 to 4 figures), “Table” for the breakdown (up to 6 rows, 5 columns), “Bar chart” for the share of each category (2 to 8 bars), “Comparison” for current budget against proposed, and “Timeline” for phasing. A layout you pick is locked in.
A card that states a figure your files do not contain says “Not in your materials: … It will be written as TBD”. Nothing is charged until you click “Generate presentation”.
Generate, check every figure against the sheet, export
Click “Generate presentation” and compare each number with the workbook, especially totals and percentages: we have not tested the AI’s arithmetic and you should not rely on it. Open the export panel (“x / y figures have a source”), then export PowerPoint (.pptx) or PDF. In the PPTX the table is a native table with plain-text cells, so nothing recalculates if you change a number in PowerPoint.
A 9-slide budget proposal, and a real table-with-weights slide
This is our suggested structure (common practice, not a standard). The layout column is the library layout the outline would normally suggest.
| # | Slide | What goes on it | Layout |
|---|---|---|---|
| 1 | The ask | Total requested, change on last year, the decision needed | Cover or Key figures |
| 2 | Where the money goes | Five or six categories with amount and share | Table |
| 3 | Share of the total | The categories as bars, the largest one in the title | Bar chart |
| 4 | What it buys | One outcome per category | Cards |
| 5 | Against last year | Last year, this year, change, reason for the change | Table |
| 6 | Two scenarios | The full request against a leaner one, and what each gives up | Comparison |
| 7 | Phasing | When the money is spent, in quarters | Timeline |
| 8 | Risks and assumptions | What would change the number | Points + takeaway |
| 9 | Decision | Approve the total, the conditions, the next review | Summary / next steps |
The worked example is a made-up team, “Kestrel Software Customer Success”, with an invented budget: an example, not a recording and not real data. The picture is slide 8 of 10 in our recorded course proposal (Data Literacy 101, 2026-10-20, deep mode): a table with a weight column, plus a large figure where the draft gave no number, written as TBD. It is not a budget, but it shows what a table-and-weights slide looks like, and what the product does when a number is missing from your file: it writes TBD instead of inventing one. In the recording, that is the slide where the PPTX has one native table and no pictures (counted in the exported file, 2026-11-09).
kestrel-cs-budget-fy2028.xlsx (example)
Summary sheet: FY2028 request against FY2027
The summary groups 31 budget lines into five categories. Total request: 1,420 (FY2027: 1,250).
| Category | FY2027 | FY2028 request | Change |
|---|---|---|---|
| People | 820 | 960 | +140 |
| Tools and software | 190 | 210 | +20 |
| Training | 60 | 70 | +10 |
| Customer events | 110 | 120 | +10 |
| Contingency | 70 | 60 | -10 |
| Total | 1,250 | 1,420 | +170 |
(All names and numbers are invented for this example. Six rows is the limit of a table slide, so the total counts as one of them: with six categories plus a total, move the total to the table note.)
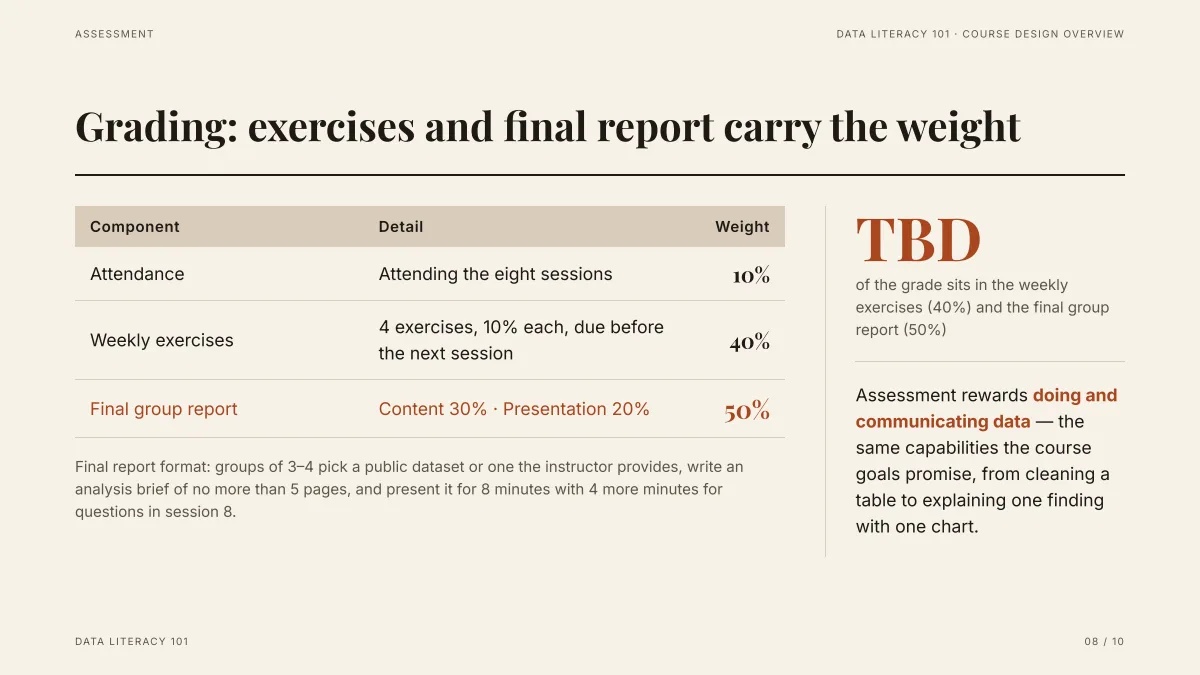
- The table has three columns and three rows, with the weight right-aligned: the same shape as a budget table with a category, a detail and an amount. A product limit applies: up to 6 rows and 5 columns, text cells only.
- The large “TBD” is what the slide shows when its source draft had no figure for that number. The same happens to a budget figure that your workbook lacks: it is marked, not made up. Fill it in your file, or write it in by hand.
- The table is a native PowerPoint table in the export, so you can edit it; there are no pictures on the slide. Nothing recalculates, so check your own totals.
What slides does a budget presentation need?
At least three: the ask and the decision, the breakdown, and the comparison with last year. Add the outcomes, the scenarios and the risks if the audience has to be persuaded rather than informed. The table above lists nine; a short budget review for a team can be five.
- Decision first: the total and what you need approved, on slide 1 or 2.
- One breakdown, grouped: five or six categories, not 30 lines.
- One comparison: against last year, or against plan.
- One slide on outcomes, so the numbers have a reason.
Which layout is best for budget numbers?
| Layout | Best for | Limit |
|---|---|---|
| Key figures | The total, the change and one more headline number | 2 to 4 figures, each a short value |
| Table | The breakdown by category, last year against this year | 2 to 5 columns, up to 6 rows, plain-text cells |
| Bar chart | The share of each category, or one value across items | 2 to 8 bars, a value above zero in at least one |
| Comparison | Current budget against proposed, or full against lean | Two sides, 2 to 5 points each |
| Timeline | Phasing of the spend by quarter | 3 to 6 milestones |
The layout set has no waterfall chart, no stacked bars and no pie chart. In our recorded launch plan, an AI edit (“turn the budget breakdown into a donut chart”, 1 credit) produced a donut chart: charts like that are exported as pictures, not as native PowerPoint charts, so you cannot edit the numbers in PowerPoint afterwards.
How do I keep the totals and percentages right?
Do all the arithmetic in your spreadsheet, and attach the result. The slides should only repeat figures that your file already contains: a figure it lacks is written as TBD, and the export panel lists the figures that have no source. We have not tested whether the AI’s own sums or percentages are right, so do not ask it to calculate; read each total on the finished slide against the sheet.
- Use the same unit on every slide (thousands or millions), and say it in the title or the table note.
- State the currency once, in the title of the first table.
- Round the same way everywhere. A total that is off by one because of rounding is the first thing a finance reader sees.
How do I present a budget increase, or a cut?
Show the change as a number and as a reason, in the same row: “People +140: two support engineers”. For an increase, add a Comparison slide with the lean scenario and what it gives up, so the choice is the board’s and not only yours. For a cut, show what stays protected. The AI drafts what your file says; the reasons have to be in the file.
Which questions should I expect?
These are common questions, not predictions. Write each answer as a two-sentence note and keep the backing numbers in a backup slide or the spreadsheet.
| Question | Where the answer lives |
|---|---|
| Why is the number higher than last year? | The “against last year” slide, with the reason in each row |
| What do we get for it? | The outcomes slide |
| What if we approve less? | The scenarios slide |
| When is the money spent? | The phasing slide |
Questions
How do I make a budget presentation with AI?
Group your budget into five or six categories in Excel, check the totals, attach the summary with a note on what each category buys, write the slide plan, check the outline cards, generate, and export an editable PowerPoint. Then check every figure against the sheet.
What should budget proposal slides include?
The total and the decision, the breakdown by category, the comparison with last year, what the money buys, a leaner scenario, the phasing, risks and assumptions, and the approval request.
Can the AI make a budget table from my Excel file?
Yes, within the table layout: 2 to 5 columns and up to 6 rows, with plain-text cells. Group your lines into categories first; the full line-by-line budget stays in the spreadsheet.
Will the AI calculate my totals?
Do not rely on it. Work the totals out in the spreadsheet and attach it: figures your file lacks are written as TBD, and we have not tested the AI’s own arithmetic. Check each total on the finished slides.
Can I add a pie chart or a donut chart?
The layout library has a bar chart, not a pie. In a recorded run, an AI edit turned a budget breakdown into a donut chart (1 credit); such charts are exported as pictures in the PowerPoint, so their numbers cannot be edited there.
Is the table editable in PowerPoint?
Yes, as a native PowerPoint table with plain text. It does not calculate: if you change one number, update the total yourself.
How much does it cost?
Writing the outline is free. Quick mode costs 1 credit per slide, deep mode 3, each AI edit 1. Exporting costs no credits, but it needs Level 2 (any credit pack, bought once) or one new person invited per deck. New accounts get 20 free credits; credit packs are one-time purchases with no subscription, and credits never expire. See the Pricing page for the packs.
Are my files used to train AI models?
No. We do not use your files to train AI models. The text of your files is sent to AI providers to write the outline and slides; the Privacy Policy has the details.
Start from your budget workbook
Attach the summary sheet, write the slide plan above, and see the outline cards, and which figures are marked TBD, before any slide is made.
Make my budget deck