How to make a chart in PowerPoint slides with AI
Updated 2026-11-04
Tell the AI which numbers to chart and what kind of chart you want, in one sentence, and it turns that slide into a bar, horizontal bar, line, area, pie or donut chart. For example: "Turn the budget breakdown on slide 9 into a donut chart, and say which item is the largest in the title." One request costs 1 credit and, in our recording, was answered about 21 seconds after the deck finished.
The AI only writes the numbers. The chart itself is drawn by the program, to scale and in your deck's colours, with a legend that lists every value and its share of the whole. That split exists for a reason we recorded: see "Why the AI writes numbers instead of drawing the chart" below.
Four steps
Open the slide whose numbers you want to chart
Open your deck in the editor and click the slide. The numbers can already be on it (a table, a few figure cards, an older chart) or you can type them in your request.
The AI only uses figures that are on that slide, in your sources, or in your message. Without real data it draws an illustration and labels it "illustrative", so it does not make numbers up.
Say what chart you want, in one sentence
Type it in the AI panel and click the arrow. Name the slide, the chart type and what the title should say:
- "Turn the budget breakdown on slide 9 into a donut chart, and say which item is the largest in the title."
- "Show the monthly sign-ups as a line chart: Jan 120, Feb 180, Mar 260."
- "Make the comparison on this slide a horizontal bar chart with 2024 and 2025 side by side."
Prefer buttons? Click "Chart" in the slide toolbar, pick a chart type such as "Donut chart", add the data if it is not on the slide (leave the box empty to use what is already there) and click "Insert donut chart". That sends the same kind of request to the AI.
Check the numbers and the shares
The new chart replaces the old one in place. For a pie or donut chart the legend lists each value and its percentage, and the percentages always add up to 100.
Every request is saved as a new version. Open "Versions" and click "Compare with the one before" to see the slide before and after; "Undo this slide" brings the old one back.
Change a number or the chart type, then export
Ask again: "Make it a bar chart", "Change social media to 20", "Add a 2026 series". The AI edits the data and the chart is redrawn exactly. Set "Edit" above the box to "This slide" so only that slide changes.
Click "Export". A PDF shows the chart as on screen. In an editable PowerPoint (PPTX) the chart is a picture, not a native PowerPoint chart: the export window says so ("Charts on slide 9 export as pictures") before you download.
A real example: a budget turned into a donut chart with one sentence
This is the last step of our "New product launch plan" replay (recorded October 19, 2026). A 12-slide plan for a made-up coffee brand had just been generated; slide 9 showed the $40K budget as a bar chart. One request was sent:
- "Turn the budget breakdown on slide 9 into a donut chart, and say which item is the largest in the title."
The AI replied that slide 9 now shows the $40K split as a donut chart and that the title says social media is the largest item. In the recording the reply came 21 seconds after the deck finished. The whole run (12 slides plus this one edit) used 13 credits, the edit being 1 of them.
Hojicha Oat Latte Launch Plan (generated deck, slide 9 of 12)
Budget skews to social media, events support sampling
Chart: bar chart, "Budget allocation by channel ($K)"
- Panel on the right: "$18K social: teaser, launch, retargeting"
| Channel | Budget |
|---|---|
| Social media | 18,000 |
| In-store events | 12,000 |
| Delivery apps | 10,000 |
(The data behind the bar chart. Slide 9 of 12.)
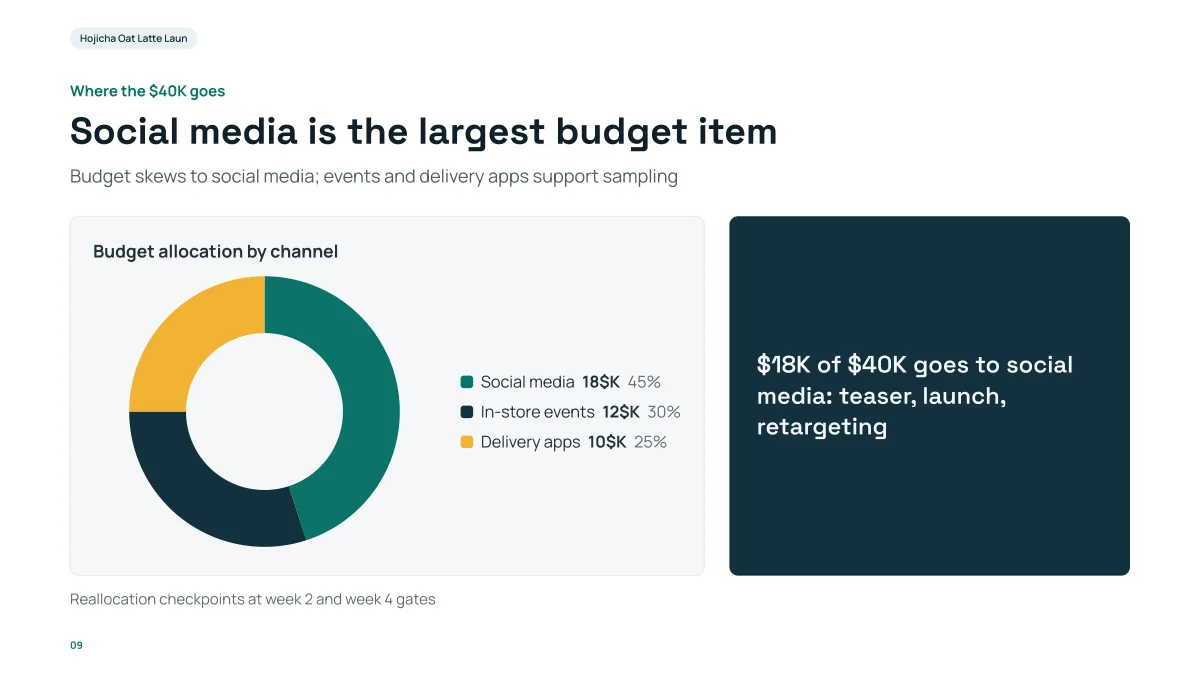
- The title now names the largest item: "Social media is the largest budget item". It was "Budget skews to social media, events support sampling" before.
- The shares are worked out by the program, not by the AI: 18, 12 and 10 out of 40 are 45%, 30% and 25%, and they add up to 100.
- The rest of the slide stayed: the right-hand panel, the footnote and the page number are as before.
- One thing to fix by hand or by asking: the legend reads "18$K" because the unit is added after each number. For money, ask for the unit written as "K USD" or "thousand dollars".
Why the AI writes numbers instead of drawing the chart
On October 19, 2026, while recording this replay, we found that a chart the AI drew by hand as SVG could be wrong in a way nobody would notice: a donut whose arcs added up to 107% of the circle, so a 45% share was drawn as 48% and a 10% share as 4%. A language model does not reliably do arc geometry.
So we split the job. The AI writes only the title, the labels and the numbers. The program draws the chart from them to scale, and works out the legend: each value and its share, rounded to whole percentages that add up to 100 (largest remainder). If an edit contains chart shapes the AI drew itself, it is turned back and the AI is told to use the numbers instead.
What this means for you: the picture always matches the numbers. A chart whose numbers did not change is not redrawn, and asking for "Change social media to 20" changes one number rather than re-inventing the chart.
Which chart types are supported
| Chart | Series | Good for |
|---|---|---|
| Bar chart | 1 to 4 | Comparing a few items, or the same items across years |
| Horizontal bar chart | 1 to 4 | Long labels and rankings |
| Line chart | 1 to 4 | Change over time |
| Area chart | 1 to 4 | Change over time when the total matters |
| Pie chart | 1 | Parts of a whole; the legend shows value and share |
| Donut chart | 1 | The same as pie, with a clear centre; the legend shows value and share |
The limits, checked every time a chart is drawn:
| Limit | Value |
|---|---|
| Labels (bars, points or slices) | 1 to 12 |
| Series (lines or bar groups) | 1 to 4 |
| Numbers | one plain number per label, for every series |
| Pie and donut | one series only, no negative values, not all zero |
| Colours | the first six colours of the deck's theme |
If the data breaks one of these rules, the AI is told what to fix and tries again. Ask for fewer than 12 slices or bars: a pie with 12 slices is hard to read anyway.
Where this works, and where it does not
- It works on slides in decks made in Gamma AI Slide and edited in its editor.
- It does not work on a PowerPoint file you upload with "Change this PPT". In that mode the AI reads the data of the charts already in your file but cannot change them; use "Edit in browser" or PowerPoint for those.
- In an editable PPTX export the chart becomes a picture. Text and tables on the slide stay editable. If you need a native PowerPoint chart you can edit in Excel, rebuild it in PowerPoint with the numbers from the slide.
- The charts are drawn for 16:9 slides in the deck's theme colours, with text in the slide's own text colour.
Questions
Can AI make a chart in PowerPoint?
Yes, in two steps of the same product: the AI turns your sentence and numbers into a chart on a slide in the editor, and you export the deck to PPTX or PDF. In the PPTX the chart is a picture, not a native chart you can edit in PowerPoint. The AI cannot change native charts inside a PowerPoint file you upload.
Which chart types can the AI make?
Bar, horizontal bar, line, area, pie and donut charts. Up to 12 labels and 4 series; pie and donut charts have one series. The "Chart" menu also lists Timeline, Flowchart, Pyramid and Funnel; this guide is about the six types drawn from numbers.
Will the AI make up the numbers?
It is told to use only figures from the slide, your sources or your message. With no real data it draws an illustration and labels it "illustrative". Check the legend against your own figures before you present.
Why do the percentages in the legend add up to exactly 100?
Because the program works them out, not the AI. It rounds to whole percentages with the largest-remainder method, so three equal shares show as 34%, 33% and 33% rather than 33%, 33% and 33%.
Can I change one number later?
Yes. Say, for example, "change social media to 20" or "make it a bar chart". The AI edits the data and the chart is redrawn from it. Each request is 1 credit, and you can undo the slide from "Versions".
How much does it cost?
Each request to the AI is 1 credit, returned if nothing could be changed. Exporting is free. New accounts get free credits, and credit packs are one-time purchases with no subscription. See the Pricing page.
Chart your own numbers
Open a deck, pick a slide and say what chart you want. Every change is a version you can compare or undo.
Make a deck and chart it