How do you make a quarterly business review presentation with AI?
Updated 2026-11-05
Attach the quarter's numbers (an Excel file or a document), say "quarterly business review for executives, 10 slides", and check the outline before any slide is made: the AI drafts one card per slide, builds the deck, and exports editable PowerPoint (.pptx). Ten quick-mode slides cost 10 credits.
A QBR is a numbers presentation, so the rule is: your figures in, no invented figures out. Below is a 10-slide structure that most QBRs follow, the prompt, and a real slide from a recorded deck showing targets against actuals-style tracking.
Four steps
Collect the quarter's numbers in one file
Targets, actuals and last quarter, in an Excel sheet or a document. Attach it on the home page: the AI reads the file instead of searching the web, and the outline follows it.
Write the request
Say what, who and how long. In the "More" options choose the scenario "Work report" and the audience "Executives". Use a request such as the template below, then click "Next" and pick quick mode.
Check every number in the outline
Compare each card with your file. A figure that is not in your material can be marked as TBD or an assumption instead of silently invented; fix or remove what is wrong. Then click "Generate presentation".
Fact-check and export
The editor has a "Fact-check" action that checks whether figures and facts have a source. Export as PowerPoint (.pptx) so you can still edit text, and add the sources page if you want one at the end.
A 10-slide QBR structure, and a real KPI slide
The table is our suggestion of a common QBR order, not a product template: adapt it to your company. Everything in the "Slide" column can be written as one outline card.
| Slide | Title idea | What to put on it |
|---|---|---|
| 1 | Q[x] business review | Quarter, team, date |
| 2 | Executive summary | Three sentences: result, reason, ask |
| 3 | KPI scorecard | Each KPI: target, actual, status |
| 4 | Main metric trend | One chart: revenue or your top KPI over time |
| 5 | Wins | Two or three results with numbers |
| 6 | Misses and causes | What fell short and why |
| 7 | Key initiatives | Progress of each project |
| 8 | Risks and dependencies | What could block next quarter |
| 9 | Next quarter plan | Priorities and targets |
| 10 | Decisions needed | The asks, with owners and dates |
The screenshot is a real slide from our recorded launch-plan deck (a made-up coffee brand, October 19, 2026). It is not a QBR, but it is the same kind of slide as your slide 3: a table with a metric, a target, a pace and a tracking method.
Prompt template (English)
Quarterly business review, 10 slides
Using the attached spreadsheet, make a quarterly business review for the executive team. Stick to the numbers in the file; don't add outside figures. 10 slides: summary, KPI scorecard against target, main metric trend, wins, misses and causes, initiatives, risks, next-quarter plan and the decisions we need.
(A template, not a recording.)
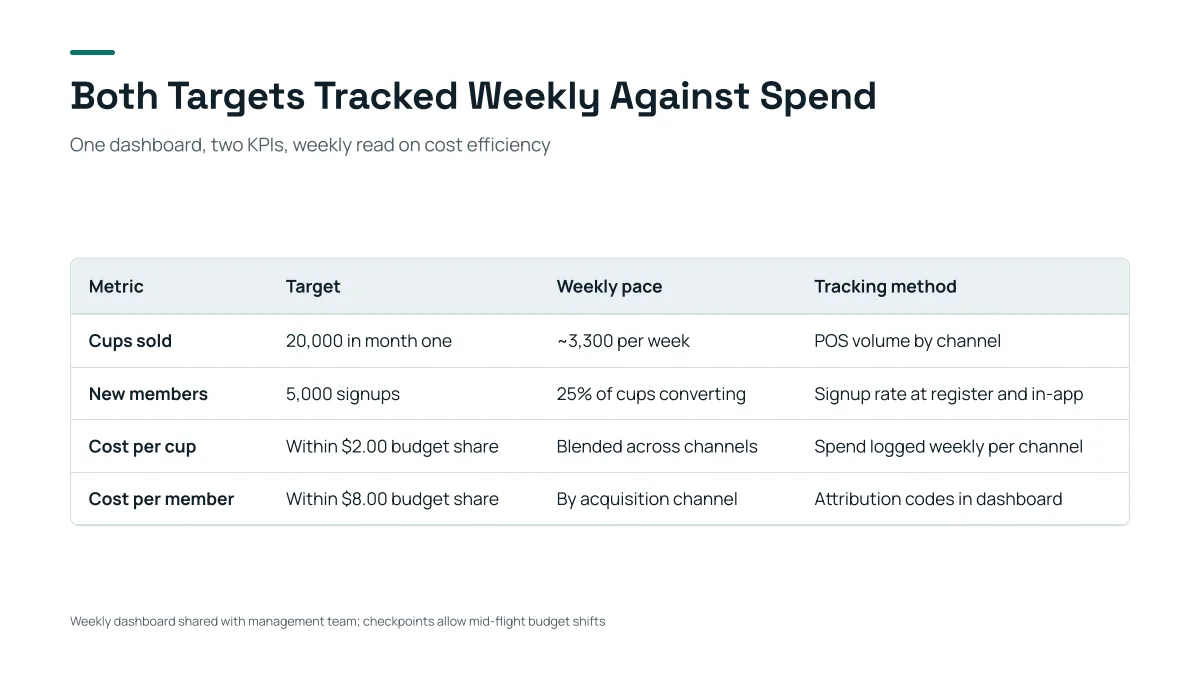
- A native table: in the exported PowerPoint you can click into it and type.
- The targets (20,000 cups, 5,000 members) are from the request. The weekly pace (about 3,300 cups a week) is the AI's own arithmetic from the first-month target, not a figure we typed.
- For a chart page, see the guide on charts in slides: it shows the same deck turning a budget table into a donut chart.
What goes in a QBR, slide by slide?
The table above lists ten slides. The first three decide whether executives keep reading: put the result and the ask on slide 2, and the scorecard on slide 3. Details and causes follow in slides 4 to 8, and slides 9 and 10 point forward.
If your review needs more, ask for up to 30 slides in total, but a longer QBR is usually an appendix: keep the main deck short.
Can I trust the numbers the AI puts in?
Trust the ones from your file after you have compared them; check anything else. The AI can propose figures you did not supply, such as a split or a date, and the editor tells you where each figure came from. Use the "Fact-check" action and the sources page before you send the deck.
Never present a figure you cannot trace to your own data.
Can I reuse last quarter's deck?
Yes, if it is a PowerPoint: upload it with "Change this PPT" and tell the AI what to update, and it changes your file in place and keeps your layout. See the guide on editing an existing PowerPoint with AI.
Questions
Can AI make a quarterly business review presentation?
Yes. Attach your numbers, describe the review and its audience, check the outline and generate. The AI drafts the structure and the text; you remain responsible for every figure.
How many slides should a QBR have?
Ten is a common length: summary, KPI scorecard, trend, wins, misses, initiatives, risks, next-quarter plan and decisions. That is a convention, not a rule. You can set 1 to 30 slides.
Does it read my Excel file?
Yes: Excel files can be attached as sources, along with PDF, Word, PowerPoint, text and images. The AI then works from your file instead of the web.
Are the tables and charts editable in PowerPoint?
Tables export as native PowerPoint tables. Charts export as pictures, so to change a number you change it in the editor (ask the AI) and export again.
How much does it cost?
Writing the outline is free. Quick mode costs 1 credit per slide, deep mode 3, each AI edit 1, and exporting is free. New accounts get 20 free credits; credit packs are one-time purchases (for example $5.99 for 40 credits plus 10 bonus) with no subscription, and credits never expire. See the Pricing page.
Start from your own numbers
Attach the quarter's spreadsheet, ask for 10 slides, and check each card against your file.
Make my QBR