How do you make a case study presentation with AI?
Updated 2026-11-07
A case study presentation tells one story in three parts: the problem the customer had, what you did, and the result in numbers. Give the AI the customer's before and after figures, in the request or in an attached spreadsheet or interview notes, tell it to stick to them, and check the outline cards before any slide is made. Nine slides is a good length; the product accepts 1 to 30 and exports editable PowerPoint (.pptx).
Below: the nine slides as a table, a rule for each number on the results slide, a prompt to paste, and the steps in the product. The structure is our suggestion, not a recording: we have no recorded case study, so the figures on the example slide belong to a made-up coffee launch, and every figure you show must come from your customer and your data.
Five steps from customer data to a case study deck
Collect the before and after numbers
Put them in one place: the baseline and the new value for each metric, the period each covers, and where each came from. Add the customer's name, size and industry, a short quote you have permission to use, and the dates of the project. A spreadsheet (Excel), a Word or text file of interview notes, or a typed list all work, up to 25 MB per file.
Write the request and attach the file
Paste the prompt below, fill the brackets, and attach your file with "Add files". Say "use only these figures; don't add outside figures; mark any missing figure as TBD". With a file attached the AI reads it instead of searching the web.
Choose the audience, scenario and tone
Under "More" choose the audience "Clients" (the AI is told to use their problem and the value to them) and the scenario "Work report" (results, problems, next steps) or "Proposal" if the case study is meant to win the next deal. Add a tone such as "Professional". Put the slide count in the request.
Click "Next" and check every number on the cards
Compare the cards with the table below. The results card must carry the figures from your file, with the same units and periods. Edit the text, drag cards to reorder, delete what you cannot support. Nothing is charged until you click "Generate presentation".
Generate, check the data slides, export
Open the sources drawer and use the "Fact-check" action to see where each figure came from, then compare each one with your file yourself. Ask for changes in plain words (1 credit each). Export PowerPoint (.pptx) to finish in PowerPoint, or PDF to send. Exporting is free.
The 9 slides of a case study, and how to write the results slide
The table is our suggested order (not a product template). Slides 3 to 5 are the problem, 6 to 8 the solution and the proof.
| # | Slide | What goes on it | Layout kind |
|---|---|---|---|
| 1 | Title | The customer, and the result as the headline: "Acme cut returns by 30% in 6 months" | Cover |
| 2 | Customer snapshot | Industry, size, location, what they sell, which of your products they use | Stats or cards |
| 3 | The challenge | What was going wrong, with one number: the baseline | Statement |
| 4 | What was at stake | The cost of leaving it: money, time, risk | Stats |
| 5 | The goal | What the customer wanted, as a target they set | Bullets |
| 6 | The solution | What you did, in three to five steps | Process |
| 7 | Results | Two to four headline numbers, each with its baseline and period | Stats |
| 8 | Results in detail | Before and after for each metric, or a trend over time | Table or chart |
| 9 | Quote, lessons and next step | One customer quote, what to repeat, the action for the reader | Quote or closing |
Each number on a results slide should carry four things. A reader who sees a bare "+30%" cannot tell what it is worth.
| Part | Write it like this | Why |
|---|---|---|
| The metric | "Return rate", not "performance" | One metric, one meaning |
| Baseline and result | "From 12% to 8.4%" | The reader sees both ends |
| The change | "-30%" or "3.6 points" | Say which one: a percent change and a change in points are different numbers |
| The period and the source | "Jan to Jun 2026, the customer's own order data" | A number with no period or source is a claim |
The picture is a real slide of the layout kind used for slide 7 (three big numbers, each with a line of context and a source line under them), from our recorded launch-plan deck (made-up coffee brand, October 2026). The numbers on it are market data for that made-up launch, not case study results.
Prompt (English)
Customer case study, 9 slides
Using the attached file, make a 9-slide customer case study about [customer], for prospective clients in [industry]. Use only the figures in the file; don't add outside figures, and mark any missing figure as TBD. Slides in this order: title with the headline result, customer snapshot, the challenge with the baseline number, what was at stake, the goal, the solution in steps, results (the [two or three] headline numbers, each with baseline, result and period), results in detail as a table of before and after, and a closing slide with the customer quote and the next step.
(Fill the brackets. Get the customer's agreement before you show their name, logo, numbers or quote.)
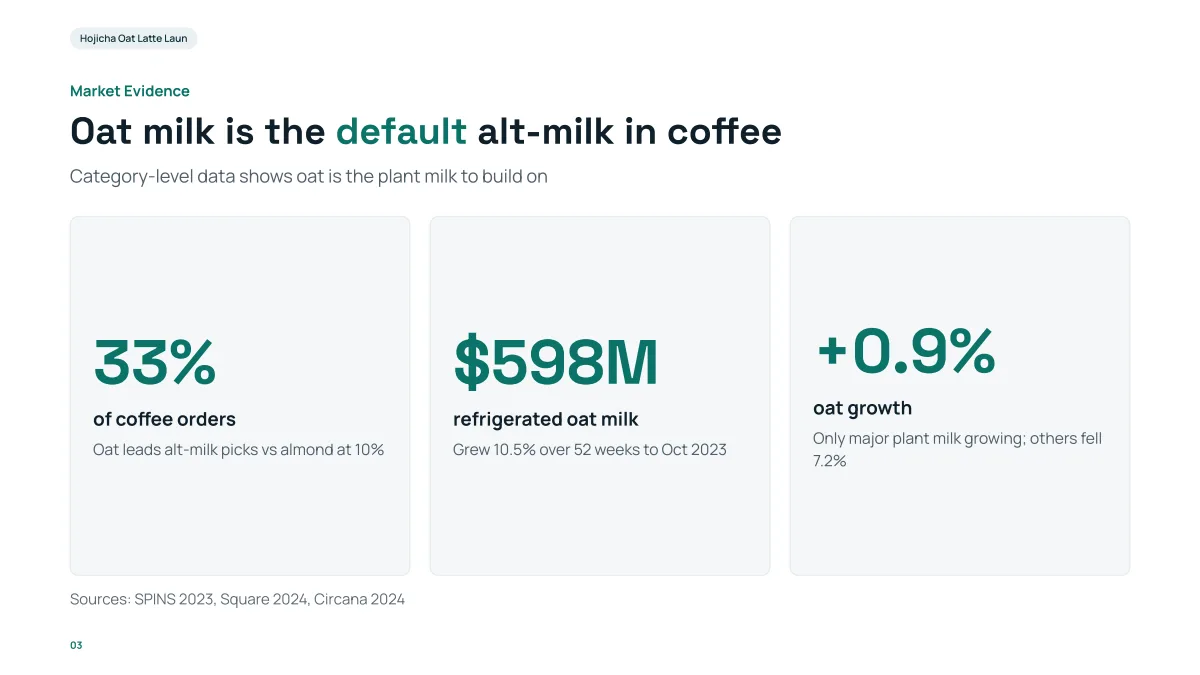
- Three big numbers, each with one line saying what it measures and the period: write your results slide the same way.
- A sources line sits under the numbers. For a case study, the source is the customer's data and the period.
- In our recording, the three numbers came from the research step (sources listed), not from us. In a case study they come from your file; check them against it.
How do I write a data slide so the numbers hold up?
- Put the baseline next to the result, with the same unit.
- Write the period and the source on the slide or in a line under it.
- Say whether a change is a percent or points, and do the arithmetic yourself: type the percentage you computed into your file or request instead of leaving it to the AI.
- Show two to four numbers on a slide. More than that goes in the detail table on slide 8.
- Use a chart for a trend over time and a table for before and after. The charts guide shows how to describe one.
The product traces figures to their sources (the sources drawer and the "Fact-check" action list each one with its source or mark it as a gap or an assumption), but it does not know whether your customer's data is right. That check is yours.
What if I have no numbers yet?
Say so. Ask the AI to mark missing figures as TBD, and it should write TBD where your file has none; in our recorded course deck a missing budget came out as TBD, not as an invented number. Fill each TBD from the customer before you send the deck. A case study without results numbers is a story, and it will read as one.
Can it write the case study from interview notes?
Yes, as a first draft of the deck. Attach the notes (Word, PDF, Markdown or text) and ask for the nine slides. The outline step reads about 24,000 characters of attached files in all (headings first for a long file), and the outline page says when a file was too long to read whole. Check the quote: it must be the customer's words, and approved by them.
How is a case study different from a project proposal or a QBR?
A case study looks back at a finished project, for a reader who is deciding whether to buy from you. A proposal asks for a decision on a project that has not started, and a quarterly business review compares targets with actuals for people who already work with you. The case study ends with a result and one next step, not an approval.
Questions
Can AI make a case study presentation?
Yes, as slides. Give it the customer's before and after figures, in the request or an attached file, tell it to stick to them, and it drafts an outline of cards you can edit and then the slides. It cannot know your customer's results, so every figure has to come from you; check them after.
What is the structure of a case study presentation?
Problem, solution, results. Our suggestion is nine slides: title with the headline result, customer snapshot, challenge, what was at stake, goal, solution, results, results in detail, and quote with a next step. This is a structure we propose, not a measured best practice.
How many slides should a case study have?
Nine is enough for a customer-facing story, and 5 to 6 for a one-page summary. The product accepts 1 to 30 slides, and the cover counts.
How do I stop the AI from adding figures I did not give?
Say it in the request ("use only these figures; don't add outside figures; mark missing figures as TBD") and attach your file so it reads that instead of searching the web. After generating, open the sources drawer and the "Fact-check" action to see where each figure came from, then compare with your file.
Can I edit the case study in PowerPoint?
Yes. The PPTX export keeps text as editable text, and PDF export is there too. Exporting is free.
How much does it cost?
Writing the outline is free. Quick mode costs 1 credit per slide, deep mode 3, each AI edit 1, and exporting is free. New accounts get 20 free credits; credit packs are one-time purchases (for example $5.99 for 40 credits plus 10 bonus) with no subscription, and credits never expire. See the Pricing page.
Start from your customer data
Attach the before and after numbers, ask the AI to stick to them, and check the results card against your file before any slide is made.
Make my case study deck