How to turn a research paper into an academic presentation with AI
Updated 2026-11-06
Add the paper as a PDF, say how long the talk is and name the order (background, question, method, results, limits, conclusion), and the AI writes an outline with one card per slide. You check it, then it builds up to 30 slides that you export as editable PowerPoint (.pptx) or PDF. Writing the outline is free; a quick-mode slide costs 1 credit.
This page is about the research talk itself: which slide carries which part of the paper, what happens to numbers, tables and charts, and how to show where each number came from. The mechanics of uploading a PDF (file limits, scanned PDFs, converter versus AI) are in the PDF guide linked below.
What we checked and what we did not: the slide and the numbers in the example are from a real recording, but that recording starts from a Word file, not a paper. How PDF text and headings are read comes from our code (checked 2026-11-06); we have not run a full-length journal paper through it for this page, and equations are untested.
Four steps from paper to talk
Add the paper and write the talk, not the paper
Click "Add files", pick the PDF, and write the request around the talk: audience, minutes and section order. For example: "A 12-slide talk for a 15-minute lab seminar from the attached paper: background, research question, method, three results, limits, conclusion. Use only numbers that are in the paper; write TBD where the paper has none."
Set "Language" for the slides (it can differ from the paper's), click "Next", then choose "Quick mode" (1 credit per slide) or "Deep mode" (3 credits per slide).
Check each card against the paper
One card is one slide: a title, the key points and a layout. Make sure each result card states one finding and the number behind it. Drag cards to reorder, merge two results into one, delete the related-work slide you do not have time for, or rewrite one card with AI. None of this costs credits.
A card that uses a number that is not in your PDF says so, and its slide would show "TBD". Fill the number in yourself or leave the TBD.
Generate, then ask for charts where a picture helps
Click "Generate presentation". For a results slide that should be a chart, ask in one sentence after the deck is built: "Turn the results table on slide 7 into a bar chart, and say in the title which condition is best." That is a separate request (1 credit) and is explained in the charts guide.
The figures printed in your paper are not read from the PDF. Save any figure you want to show as PNG or JPG and add it as its own file.
Export with a sources page
Click "Export". Before the download you see how many figures have a source in your file (for example "11 / 12 figures have a source") and how many are TBD. Tick "Add a sources page at the end": it adds pages that list every figure shown on the slides and where it comes from in your files. Then export as PPTX or PDF.
A real example: three numbers in one paragraph become a proportion bar
We have no recording that starts from a paper. This one starts from a Word file and shows the same step a results or method slide goes through: numbers in running text become a visual. It is our "Course design overview" run (October 19, 2026, deep mode, 10 slides, 31 credits including one AI edit).
Section 5 of the draft says each 90-minute session has 20 minutes of explanation, 60 of hands-on practice and 10 of wrap-up. Slide 7 draws that as one bar split in the same proportions, with the 20, 60 and 10 as large figures below. We counted the shapes in the exported PPTX: this slide is 26 native shapes and text boxes and no pictures, so the bar and its labels are editable in PowerPoint. It is not a chart object that holds data; for a real chart see the charts guide.
data-literacy-101-course-draft.docx
5. How each session runs
20 minutes of explanation and demo, 60 minutes of hands-on practice (the instructor and a teaching assistant walk around to help), and 10 minutes to wrap up and set the week's exercise.
(The whole paragraph, apart from one sentence about practice data.)
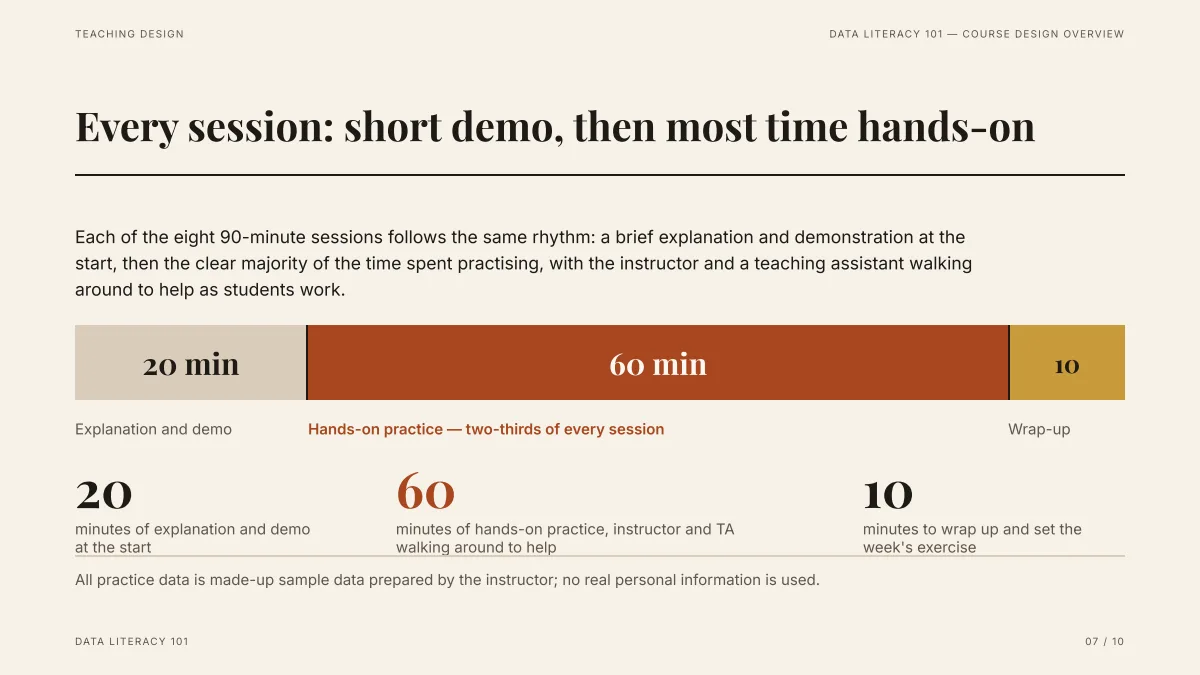
- 20, 60 and 10 are exactly the numbers in the source; the bar widths follow their proportions.
- The title states the reading ("most time hands-on") rather than naming the topic. That is the kind of title a results slide needs.
- In the PPTX the slide is shapes and text, not a picture, so you can retype a label.
Which slide carries which part of the paper?
A suggested layout for a 15-minute talk of about 12 slides. It is our suggestion based on the common one-to-two-minutes-per-slide rule of thumb, not a standard and not a recorded run; adjust it to your field and your time slot.
| Slides | Part of the talk | Put on the slide | Leave in the paper |
|---|---|---|---|
| 1 | Title | Title, authors, venue or course | Affiliation details |
| 2 | Background | The problem in one sentence and why it matters | The literature review |
| 3 | Research question | The question or claim, and what is new | Related-work comparison tables |
| 4 to 5 | Method | Data, setup and the one step that matters, as a diagram or three short lines | Parameter lists, proofs |
| 6 to 8 | Results | One finding per slide: the number, then what it means in the title | Every table row |
| 9 | Limits | Two or three honest limits | Long threats-to-validity text |
| 10 | Conclusion | The answer to the question from slide 3, with the key number | A repeat of the abstract |
| 11 | Next steps or discussion | One open question for the audience | Future-work lists |
| 12 | Sources (optional) | The sources page from the export | The full reference list |
Write the request with this order and the AI follows it: you set the order in the request and fix it in the outline cards.
How are numbers, tables and charts handled?
| In your paper | What happens | What to do |
|---|---|---|
| A number in the text | It is read and can appear on a slide as a figure; the export checks it has a source | Compare it with the paper once at the end |
| A table | In a PDF, a table is read as lines of text, not as a table with rows and columns (from our code: PDF pages are read as text only). In a Word file tables are read as tables | Check every table number on the slide against the paper; for a Word version of the paper, add that instead |
| A chart or figure in the PDF | Not read | Save it as PNG or JPG and add it as a file, or ask for a new chart from the numbers |
| A number the paper does not have | Not invented; the card says it is missing and the slide gets "TBD" | Fill it in or remove the sentence |
| An equation | Untested; it depends on how the PDF stores it | Describe it in words on the slide, or add an image of it |
How do I show sources and citations?
The "Add a sources page at the end" option lists each figure shown on the slides with the file and place it was read from. It is a list of where numbers came from in your uploaded files, not a formatted bibliography: it does not turn references into APA or IEEE style.
For works the paper cites, write them in the request or type them on the slide yourself, for example "(Author, 2024)" in the footer. A request line such as "Cite only works named in the paper; no outside references" keeps the AI from adding sources of its own.
The outline reads the paper's headings first (the PDF's bookmarks, or lines like "3.2 Experiments"), so section structure usually carries through. A paper with neither is read by its opening and passages chosen per slide: check that the cards cover the whole paper.
What if the paper is long?
A long paper is not read whole in one go. When a file is too long, the outline page's sources panel says so, for example that the outline used its headings and opening, and that each slide picks the passages it needs from the whole file. So a result on page 14 can still reach a results slide, but check that the final slides do not rely only on the introduction.
We have not timed or scored this on a real journal paper for this page. The behaviour above is from the code and the on-screen note, and our own tests use a 30-page generated PDF.
Questions
Can AI make a research presentation from a paper?
Yes, if the PDF has selectable text. Add it, say the talk length and the section order, check the outline, and the AI builds up to 30 slides that export as PowerPoint or PDF.
Will the figures and charts from my paper appear on the slides?
No. Pictures and figures inside a PDF are not read. Save the ones you need as PNG or JPG and add them, or ask the AI for a chart from the numbers.
Are the tables in my PDF kept as tables?
Not from a PDF: its pages are read as text. Check table numbers against the paper. A Word version of the paper keeps its tables.
Does it write my references?
No. It can add a sources page listing where each figure on the slides came from in your files. Formatted references you add yourself.
How many slides for a 15-minute research talk?
About 8 to 15 by the common rule of one to two minutes per slide; the suggested layout above uses 12. The maximum per deck is 30.
How much does it cost?
Writing the outline is free. Quick mode costs 1 credit per slide, deep mode 3, each AI edit 1, and exporting is free. New accounts get 20 free credits; credit packs are one-time purchases with no subscription. See the Pricing page.
Try it with your paper
Add the PDF and read the outline first. That step is free.
Add a paper and start