How do I make a competitive analysis presentation with AI?
Updated 2026-11-12
Use a feature matrix when the audience is deciding what to build, a pricing table when it is deciding what to charge, a SWOT per competitor when it is deciding how to fight, and a positioning map only for a one-slide overview. Nine slides is a good length (8 to 12 is common): answer first, landscape, matrix, price, head-to-head, where you lose, actions, sources.
A competitive analysis presentation answers four questions in order: who you compare yourself with, on which criteria, where you win and lose, and what you will do about it. Eight to twelve slides is common: a landscape slide, one matrix of competitors against criteria, one or two head-to-head slides, a slide on where you lose, and a closing slide of actions.
To build it with Gamma AI Slide, put your research in a file (every competitor fact with its source and date), attach it, write the slides you want, check the outline cards, and generate. You get an editable PowerPoint (.pptx). Writing the outline is free; a quick-mode slide is 1 credit, so a 9-slide deck is 9 credits.
Two limits up front. The product has no 2×2 positioning map (the quadrant chart with two axes): it builds a table, side-by-side cards, a left-versus-right comparison and a bar chart. And it does not research your competitors for you: put the facts in your file. We have no recorded competitive analysis; the picture is a different real table slide, and the example product and competitors are made up.
Six steps from research notes to a competitive analysis deck
Collect competitor facts with a source and a date
Make a table in Excel or Word: one row per competitor, one column per criterion (price, key feature, target customer, a number you can measure), and next to each fact its source and the date you checked it (“pricing page, 2027-03-02”). Competitor facts go stale, and a number with no source is the first thing a sceptical audience challenges.
Do not count on the AI to look competitors up. The outline step can research a topic (the interface says “Researching to work out what to cover…”), but a fact you need in the deck should be in your file, where you can check it.
Choose five criteria at most
A table slide takes 2 to 5 columns and up to 6 rows, with plain-text cells. Pick up to five criteria that matter to your buyer and up to six competitors (or five competitors plus you). More than that, split across two slides.
Write the request and attach the file
On the home page, click “Add files” (each up to 25 MB), attach the research file, and paste the request below with your slide plan. Click “Next” and choose “Quick mode” (1 credit per slide).
Set scenario, audience and tone
Under “More”, set the audience (“Executives” for a strategy review, “Teammates” for a sales enablement session, “Investors” for a pitch) and the scenario (“Work report” or “Proposal”). Tone “Rigorous” suits a comparison where every claim must hold up. “Text per slide” at “Concise” keeps the table cells short.
Pick the layout on each outline card
Choose “Table” for the matrix, “Comparison” for you against one competitor (2 to 5 points per side), “Cards” for competitor profiles (2 to 4 cards), “Bar chart” for one measured value across competitors (2 to 8 bars). A layout you pick is locked in.
A card that states a figure your file does not contain says “Not in your materials: … It will be written as TBD”. Nothing is charged until you click “Generate presentation”.
Generate, check every competitor claim, export
Click “Generate presentation”. Open the export panel: “x / y figures have a source”, and “Add a sources page at the end” puts the sources in the deck. Read every cell against your file: the AI shortens text to fit a cell, and a shortened claim about a named competitor can say more than the source does. Then export PowerPoint (.pptx) or PDF. Exporting costs no credits, but it needs Level 2 (any credit pack, bought once) or one new person invited per deck.
A 9-slide competitive analysis, and a real table slide
This is our suggested structure (common practice, not a standard). The layout column is the library layout the outline would normally suggest.
| # | Slide | What goes on it | Layout |
|---|---|---|---|
| 1 | Cover | What you compared, which market, the date of the data | Cover |
| 2 | Answer first | Where you lead, where you trail, in two or three lines | Points + takeaway |
| 3 | The landscape | Who you compared with and why these competitors | Cards |
| 4 | The feature matrix | Competitors against up to five criteria | Table |
| 5 | Price | One price or cost figure per competitor | Bar chart |
| 6 | Head to head | You against the closest competitor, strengths on each side | Comparison |
| 7 | Where we lose | The criteria where a competitor is ahead, and why it matters (or not) | Points + takeaway |
| 8 | What we do about it | Three to five actions with owners | Steps |
| 9 | Sources and date | Where each fact came from, and when it was checked | Table |
There is no layout for a 2×2 positioning map, a spider chart or a coloured feature grid. For a 2×2, draw four boxes in PowerPoint after export, or ask the AI assistant in the editor and look at the result; we have not tested that request. A feature grid with ticks can be typed as “Yes / No / Partial” in table cells.
The worked example is a made-up product, “Lumen Notes”, against three made-up competitors, with invented facts: an example, not a recording and not real data. The picture is slide 2 of 12 in our recorded launch plan (a made-up coffee brand, 2026-10-19, quick mode): an agenda table with three columns and five rows, in the Table layout. It is not a competitor matrix, but it is the same layout your slide 4 uses, and in the PPTX it comes out as one native table with no pictures (counted in the exported file, 2026-11-09).
lumen-notes-competitors.xlsx (example)
Competitor research, checked 2027-03-02
Each fact has a source (the competitor’s pricing page, its help centre, our own tests) in the next column of the sheet; only the facts are shown here.
| Product | Starting price | Offline mode | Team sharing | Import from Word |
|---|---|---|---|---|
| Lumen Notes (us) | $6 per user | Yes | Yes | Yes |
| Competitor A | $9 per user | No | Yes | Yes |
| Competitor B | Free, paid from $12 | Yes | Paid plans only | No |
| Competitor C | $4 per user | Partial | No | Yes |
(All names and facts are invented for this example.)
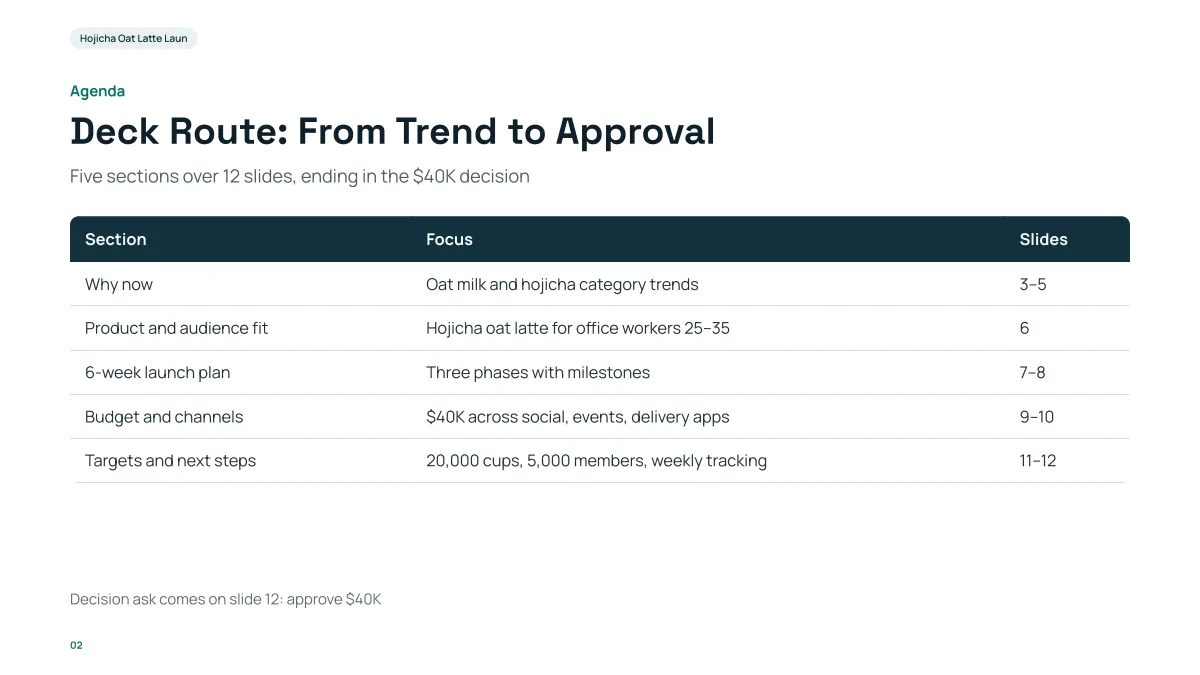
- Three columns and five rows, one short phrase in each cell: your competitor matrix has the same density, with up to five columns and six rows as the limit.
- The header row is dark and the first column carries the row names. Put the competitors in the first column and the criteria in the headers.
- The table is a native PowerPoint table in the export, so you can edit the cells and add colour (for example a green cell where you lead). The values in this slide are about a coffee launch and are not ours to reuse.
Which layout fits which part of a competitive analysis?
| What you want to show | Layout | Limit |
|---|---|---|
| Competitors against criteria | Table | 2 to 5 columns, up to 6 rows, plain-text cells |
| You against one competitor | Comparison | Two sides, 2 to 5 points each, optional verdict line |
| One profile per competitor | Cards | 2 to 4 cards, a heading and about two lines each |
| One number across competitors (price, share) | Bar chart | 2 to 8 bars, one unit |
| Where you stand, in words | Points + takeaway | 2 to 5 points and one highlighted conclusion |
| Two axes, quadrants, bubbles | Not available | No 2×2, bubble or radar layout |
Which criteria should I compare on?
Use the criteria your buyer uses to decide, not the ones you happen to win. Five at most per slide.
| Kind of criterion | Example (made up) | Why it works |
|---|---|---|
| A price or cost | Starting price per user | A number anyone can check |
| A capability that is yes or no | Offline mode | Easy to verify, shown as Yes, No or Partial |
| A measured result | Time to import 100 notes | Needs your own test, with the date and setup written down |
| A fit | Best for teams under 20 | A judgement: label it as yours |
Mixing the kinds on one slide is fine, as long as you can tell a fact from a judgement in the notes.
How do I keep competitor claims accurate and fair?
Use only what you can show. This is common good practice, not legal advice; if the deck will be public or used in advertising, have your legal team check comparative claims.
- Date every fact and show the date on the slide or the sources page.
- Prefer public sources: a pricing page, a help-centre article, a release note.
- Show where you trail. A deck where you win every row is not believed.
- Keep judgements (“best for small teams”) apart from facts, and label them as yours.
- Re-check the facts before each use. A pricing page can change in a week.
Does the product look up competitors for me?
Do not rely on it. The outline step can research a topic, but the facts in your deck should come from your file, where you have the source and the date. If a card asks for a figure your file lacks, it says so and writes TBD rather than inventing one; the export panel counts how many figures have a source.
How is this different from a SWOT or a strategy deck?
A SWOT looks at your own position (strengths, weaknesses, opportunities, threats). A competitive analysis compares you with named alternatives on shared criteria, with evidence for each cell. A strategy deck decides what to do. A good competitive analysis feeds the “where we lose” and “what we do” slides of the other two; see the guides on SWOT analysis and on strategy presentations.
Which of the four comparison methods fits my meeting?
Pick the method by the decision the audience has to make. The first three are what the product builds; the positioning map it does not.
| Method | Best for | In the product | Watch out for |
|---|---|---|---|
| Feature matrix | A product or roadmap review: who has what | Table: 2 to 5 columns, up to 6 rows, cells typed as Yes / No / Partial | Counting features instead of what the buyer cares about |
| Pricing table | Sales, packaging and pricing decisions | Table for plans and prices; Bar chart (2 to 8 bars) for one price figure | Prices that change: date every row |
| SWOT per competitor | Strategy and battlecards: how to compete with one rival | Cards (up to 4, one per letter) or a four-column Table, one slide per rival | Writing their strengths as adjectives, not facts |
| Positioning map (2×2) | A one-slide overview of who sits where | Not available: no 2×2 layout. Draw it in PowerPoint after export | Axes that were picked so that you land top right |
A deck for a leadership team usually needs the matrix and one SWOT slide for the closest rival; a sales enablement deck needs the pricing table and the head-to-head. Do not use all four: each slide you add dilutes the answer.
Where does the competitor data come from, and how do I write the source?
The product does not look competitors up for you, so collect the facts first. In common practice, public sources are the safest because anyone can check them. Put the source and the date in your file, and ask for the sources page.
| Source | Good for | How to write it on the slide |
|---|---|---|
| Pricing page | Prices, plan limits | “Pricing page, checked 2027-03-02” |
| Help centre or documentation | Features, limits, integrations | “Help centre, article title, 2027-03-02” |
| Release notes or changelog | When a feature shipped | “Release notes, 2027-02-14” |
| Annual report or filing | Revenue, headcount (public companies) | “Annual report 2026, page 12” |
| Your own test | Speed, quality, a measured result | “Our test, 100 notes, same laptop, 2027-03-01” |
| Customer interviews or sales notes | Why deals are lost | “5 lost-deal calls, Q1 2027”, and call it opinion, not fact |
Put the source in a column next to each fact in the file. In the export panel, “Add a sources page at the end” puts the sources into the deck, and the panel counts how many figures have a source. A cell with no source is the first thing a sceptical audience will challenge.
What are the common mistakes in a competitive analysis deck?
| Mistake | Why it hurts | Fix |
|---|---|---|
| Comparing against every vendor | The audience loses the point | Use the 3 to 5 competitors your buyers actually shortlist |
| A matrix with ticks only | Hides that “Yes” can mean very different things | Add “Partial” and a footnote for each partial |
| Facts from different dates | A price from last year next to this year’s | One check date for the whole deck, on the cover |
| Only criteria where you win | The deck is not believed | Show the rows where you trail, on their own slide |
| A matrix with no conclusion | “So what?” goes unanswered | Put the answer on slide 2 and the actions on slide 8 |
| Judgements written as facts | One wrong claim can discredit the rest | Label “best for small teams” as your view |
Questions
How do I make a competitive analysis presentation with AI?
Collect competitor facts with a source and date in one table, attach it, write the slide plan, check the outline cards, generate, and export an editable PowerPoint. Then read every cell about a named competitor against your sources.
What should a competitive analysis presentation include?
The answer first, the landscape, a competitors-against-criteria matrix, a price or metric comparison, a head-to-head with the closest competitor, where you lose, the actions that follow, and the sources with their dates.
Can it make a 2×2 positioning matrix?
No. The layout library has a table, a left-versus-right comparison, cards and a bar chart, but no 2×2 map. Draw the quadrant in PowerPoint after export, or try asking the AI assistant in the editor and check the result.
Can the AI find competitor information for me?
Do not count on it. Put the facts, with sources and dates, in the file you attach: figures your file lacks are written as TBD, and the export panel shows how many figures have a source.
How many competitors fit on one slide?
A table slide holds up to 6 rows and 5 columns, so about five competitors plus you against up to five criteria. Cards hold 2 to 4 profiles and a bar chart 2 to 8 bars.
Can I add competitor logos?
We have not checked a logo feature for the generated slides, so add logos in PowerPoint after export. The table is a native PowerPoint table, so you can edit it there.
Which comparison method should I use: matrix, positioning map, SWOT or pricing table?
Use a feature matrix for product decisions, a pricing table for pricing and sales decisions, a SWOT per competitor for strategy, and a positioning map only as a one-slide overview. The product builds the first three (Table, Cards, Bar chart); it has no 2×2 positioning layout, so draw that in PowerPoint after export.
How do I cite competitor data on a slide?
Write the source and the check date next to the fact, for example “Pricing page, checked 2027-03-02”, keep them in a column of your file, and turn on “Add a sources page at the end” when you export. Prefer public sources, and label your own tests and opinions as such.
How much does it cost?
Writing the outline is free. Quick mode costs 1 credit per slide, deep mode 3, each AI edit 1. Exporting costs no credits, but it needs Level 2 (any credit pack, bought once) or one new person invited per deck. New accounts get 20 free credits; credit packs are one-time purchases with no subscription, and credits never expire. See the Pricing page for the packs.
Are my files used to train AI models?
No. We do not use your files to train AI models. The text of your files is sent to AI providers to write the outline and slides; the Privacy Policy has the details.
Start from your competitor research
Attach the table of competitor facts, write the slide plan above, and see the outline cards, and which figures are marked TBD, before any slide is made.
Make my competitive analysis deck