How do I make an OKR presentation with AI?
Updated 2026-11-12
An OKR presentation for a quarterly review takes 8 slides: one overview of the objectives, one slide per objective with its key results, current progress and a confidence score, then next quarter’s changes. Good key results are numbers with a baseline and a target; bad ones are tasks.
In more detail, an OKR presentation usually has one overview slide with every objective, then one slide per objective listing its key results with a baseline, a target and an owner. For a review you add the score and a short “what we learned” line. Two to four objectives with three to five key results each is a common size; more than that and the slides stop being readable.
To build it with Gamma AI Slide, put your OKRs in a file (a Word or Excel table works well), attach it, write the slides you want, check the outline cards, and generate. You get an editable PowerPoint (.pptx). Writing the outline is free; a quick-mode slide is 1 credit, so an 8-slide deck is 8 credits.
About the “OKR slides template”: the product has no fixed OKR template. The structure table on this page is the template, and the AI fills it from your file. We have no recorded OKR deck; the picture is a different real slide (three numbered goals) and the example team is made up.
Six steps from an OKR sheet to OKR slides
Put the OKRs in one table
One row per key result, with these columns: objective, key result, baseline, target, owner, and (for a review) current value or score. Keep each cell short: a table slide takes cells of up to about 60 characters, so “Cut first-reply time from 9 h to 4 h” fits and a paragraph does not.
Save it as Excel (.xlsx) or Word, or paste the table into a document. Each file can be up to 25 MB.
Write the request and attach the file
On the home page, click “Add files”, attach the OKR file, and paste the request below with your slide plan. Click “Next” and choose “Quick mode” (1 credit per slide).
Set scenario, audience and detail
Under “More”, set the scenario to “Work report” for a review or “Proposal” if the OKRs need approval, and the audience to “Teammates” (a team kickoff) or “Executives” (a company review). “Text per slide” at “Concise” keeps key results readable. Put the number of slides in the request.
Pick the layout on each outline card
For the overview of objectives choose “Cards” (2 to 4 cards, so up to four objectives). For each objective’s key results choose “Table” (up to 5 columns and 6 rows). For the two or three numbers that matter most choose “Key figures”. A layout you pick is locked in; otherwise the AI suggests one.
A card that states a figure your file does not contain says “Not in your materials: … It will be written as TBD”. Nothing is charged until you click “Generate presentation”.
Generate and check each key result
Click “Generate presentation”. Check that every baseline and target matches your sheet, that no key result moved to the wrong objective, and that a shortened key result still says the same thing. The export panel shows “x / y figures have a source”.
Export and keep the file for the next quarter
Click “Export” and choose PowerPoint (.pptx) or PDF. Exporting costs no credits, but it needs Level 2 (any credit pack, bought once) or one new person invited per deck. The PPTX table is a native PowerPoint table, with plain-text cells, so update the scores there or change the sheet and generate again. Next quarter, start from the new sheet and the same request.
An 8-slide OKR deck for a team kickoff, and a real “three goals” slide
This is our suggested structure for a team kickoff or a quarterly review (common practice, not a standard). The layout column is the library layout the outline would normally suggest.
| # | Slide | What goes on it | Layout |
|---|---|---|---|
| 1 | Cover | Team, quarter, “OKR kickoff” or “OKR review” | Cover |
| 2 | Last quarter in one slide | Final scores and one lesson each (skip for a first kickoff) | Key figures |
| 3 | This quarter’s objectives | Three objectives, each in one outcome sentence | Cards |
| 4 | Objective 1 and its key results | Key result, baseline, target, owner | Table |
| 5 | Objective 2 and its key results | Same columns | Table |
| 6 | Objective 3 and its key results | Same columns | Table |
| 7 | Dependencies and asks | What you need from other teams, by when | Table |
| 8 | Check-in rhythm and next steps | When progress is reviewed and who updates the scores | Summary / next steps |
The worked example is a made-up support team, “Brightwave Support”, with invented numbers: it is an example, not a recording and not real data. The picture is slide 5 of 10 in our recorded course proposal (Data Literacy 101, 2026-10-20, deep mode). It is not an OKR, but it shows two things you need: three goals in a row, and the effect of a one-line AI edit. In the recording, the edit “start each goal with ‘By the end of the course, students can’” rewrote all three goals as outcomes (an AI edit is 1 credit). That is the habit that separates an objective from a task.
brightwave-okrs.xlsx (example)
Brightwave Support: Q1 2028 OKRs
Objective 1: Customers get answers fast. Objective 2: Customers solve more on their own. Objective 3: The team can grow without burning out.
| Objective | Key result | Baseline | Target | Owner |
|---|---|---|---|---|
| 1 Fast answers | First reply time | 9 h | 4 h | Dana |
| 1 Fast answers | Tickets answered inside 1 business day | 71% | 90% | Dana |
| 2 Self-service | Help-centre articles covering top 20 questions | 8 of 20 | 20 of 20 | Ravi |
| 2 Self-service | Tickets deflected by articles | 12% | 25% | Ravi |
| 3 Sustainable team | Weekend on-call shifts per person per month | 3 | 1 | Mei |
(All names and numbers are invented for this example.)
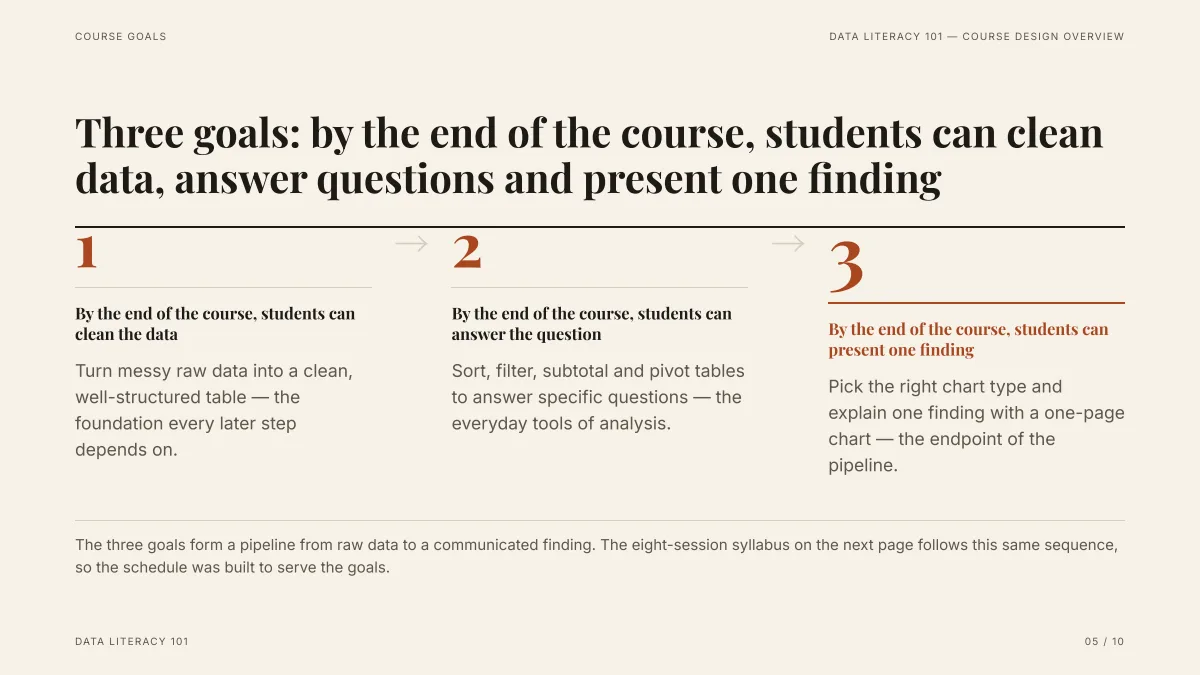
- Each goal is one outcome sentence with the same opening words. In an OKR deck, your objective slide should read this way: something a person can do or a state the customer is in, not “improve support”.
- Three numbers in a row is about the limit of this kind of slide. It is the picture for your objectives overview; the key results go on the table slides after it.
- The numbers and goals are from a course proposal and are not ours to reuse. The slide came from a deep-mode run (3 credits a slide) with a free design; a quick-mode run would use the Cards layout for the same content.
What is the difference between an objective and a key result?
An objective says where you want to get, in words; a key result says how you will know, in a number. This is the common OKR practice, and your company’s guide wins if it differs.
| Objective | Key result | |
|---|---|---|
| What it is | A qualitative outcome | A measurable result |
| Written as | One sentence a person can remember | A metric with a baseline and a target |
| Example (made up) | Customers get answers fast | First reply time from 9 h to 4 h |
| Test | Would the team be proud to say it? | Could two people agree whether it was met? |
A key result that reads like a task (“launch the new help centre”) belongs in the plan, not in the table: ask yourself what number would change.
How many objectives and key results fit on the slides?
| Item | Common size | What the product allows |
|---|---|---|
| Objectives per team | 2 to 4 | Cards layout: 2 to 4 cards |
| Key results per objective | 3 to 5 | Table layout: up to 6 rows, 2 to 5 columns |
| Headline numbers | 2 to 4 | Key figures layout: 2 to 4 numbers |
The first two columns are common practice; the last is the layout limit. More key results than six: split them over two slides rather than shrink the text, because the table does not scale below its row limit.
How do I show scores and progress?
Write the score as plain text in a column of the table (“0.7” or “70%”), and use whatever scale your company uses: many teams score from 0.0 to 1.0, but that is a convention, not a rule. For one objective’s progress, a Bar chart slide (2 to 8 bars) can show current value against target; open the exported file and look at the bars, as we have not checked how they come out in PowerPoint. A coloured traffic-light cell is not available: table cells are plain text, so type “On track”, “At risk” or “Off track”, or colour the cells in PowerPoint.
Put the figures in the sheet, because a figure that your file lacks is written as TBD. The AI does not calculate your scores for you; work them out in the spreadsheet first.
Is there an OKR slides template?
Not as a fixed file. What you get is the structure above, built from your own OKRs in a theme or template style you choose, as an editable PowerPoint. To reuse it next quarter, change the sheet and generate again (the outline is free, slides 1 credit each in quick mode), or edit the numbers in the exported file.
How is an OKR deck different from a business review?
An OKR deck is built around the objectives and their measures, and it looks forward as much as back. A business review is built around the period’s results and problems. If you present both in one meeting, use the OKR slides as the “targets” section of the review.
What does a quarterly OKR review need on each slide?
A review adds three things to a kickoff: where each key result stands now, how confident the owner is, and what changes next quarter. This is our suggested structure (common practice, not a standard); the same columns work as a table slide per objective.
| Part | What to write | Example (made up) | Layout |
|---|---|---|---|
| Objective | One outcome sentence, no numbers | Customers get answers fast | Cards on the overview, a title on each objective slide |
| Key result | A metric with baseline and target | First reply time, 9 h to 4 h | Table row |
| Current progress | The latest value and the date | 5.5 h on 2027-03-15 | Table column, plain text |
| Confidence score | One number from the owner on reaching the target by quarter end | 7 out of 10 | Table column, plain text |
| Next-quarter adjustment | Keep, change the target, or drop, with one reason | Keep. Raise target to 3 h | Summary / next steps |
The scale for the confidence score is your company’s choice: 1 to 10 and 0.0 to 1.0 are both common. Write the scale once on the slide. Work out progress in your sheet first, because the AI does not calculate it, and a figure your file lacks is written as TBD.
What is a good key result and what is a bad one?
A key result is good when two people could look at the number and agree whether it was met. All examples below are made up.
| Bad key result | Why it is weak | Better key result |
|---|---|---|
| Launch the new help centre | A task: it can be done and change nothing | Tickets deflected by articles from 12% to 25% |
| Improve customer satisfaction | No number, no baseline | Satisfaction score from 4.1 to 4.5 out of 5 |
| Answer tickets faster | No target | First reply time from 9 h to 4 h |
| Hold 10 team meetings | An activity, not a result | Weekend on-call shifts per person per month from 3 to 1 |
| Be the best support team | Cannot be measured | Tickets answered inside one business day from 71% to 90% |
A quick test: if the key result can be marked done without any number moving, rewrite it. Put tasks in the plan slide, not in the table.
Questions
How do I make an OKR presentation?
Put your OKRs in one table (objective, key result, baseline, target, owner), attach it, write the slide plan, check the outline cards, generate, and export an editable PowerPoint. One overview slide plus one table slide per objective is the usual shape.
What should an OKR presentation include?
Last quarter’s scores (for a review), the objectives in one outcome sentence each, a table of key results per objective with baseline, target and owner, dependencies on other teams, and the check-in rhythm.
Is there an OKR slides template?
There is no fixed OKR template. The structure table on this page is the template, and the AI fills it from your own sheet; you can then edit the PowerPoint or generate again next quarter.
Can I generate OKR slides from an Excel file?
Yes. Attach the .xlsx (up to 25 MB); a sheet of more than 2,000 rows is read summed by month or category, and the sources panel says so, so keep the OKR sheet short.
Does the product score my key results?
No. Work out the scores in your spreadsheet and put them in the file; the slides show what your file says, and a figure it lacks is written as TBD.
What is a confidence score in an OKR review?
It is the owner’s own estimate, usually a number such as 7 out of 10, of reaching the key result target by the end of the quarter. Teams use it to spot trouble before the score is final. It is a common practice rather than part of the OKR definition, so use the scale your company uses and write it on the slide.
What is a good key result for an OKR presentation?
A measurable result with a baseline and a target, such as first reply time from 9 hours to 4 hours. A task like “launch the new help centre” is not a key result, because it can be finished without any number changing.
How many slides should a quarterly OKR review have?
Eight is a common size: cover, last quarter in one slide, the objectives overview, one table slide for each of three objectives, dependencies and asks, and next steps. With two objectives it fits on six slides; the product makes 1 to 30.
How much does it cost?
Writing the outline is free. Quick mode costs 1 credit per slide, deep mode 3, each AI edit 1. Exporting costs no credits, but it needs Level 2 (any credit pack, bought once) or one new person invited per deck. New accounts get 20 free credits; credit packs are one-time purchases with no subscription, and credits never expire. See the Pricing page for the packs.
Are my files used to train AI models?
No. We do not use your files to train AI models. The text of your files is sent to AI providers to write the outline and slides; the Privacy Policy has the details.
Start from your OKR sheet
Attach the table, write the slide plan above, and see the outline cards, and which figures are marked TBD, before any slide is made.
Make my OKR deck