How do I make a weekly status report presentation with AI?
Updated 2026-11-07
Write the week’s updates in a file (one line per item: done, in progress, blocked, next, risks), attach it, set the scenario to "Work report", ask for 6 slides, check the outline cards, and generate. You get an editable PowerPoint (.pptx) with the same six slides every week: cover with the overall status, done this week, status by workstream, risks and issues, next week, decisions needed. Writing the outline is free; a quick-mode slide costs 1 credit, so a six-slide update is 6 credits.
This page covers what a status deck needs that a general report deck does not: a RAG (red, amber, green) table and a way to repeat the same structure each week. It also says where the product stops. In quick mode a table slide holds at most 6 rows and 5 columns, and its cells are plain text: the product does not colour a cell red, amber or green for you, so the colour is a step you do (or ask for and check).
What we have and have not done: we have no recorded weekly status report. The slide shown below is from a different real recording (a course proposal) and is there to show how a table comes out. The table limits come from our code (read 2026-11-07), the rest of the product facts from the same code and the recorded runs.
Five steps from weekly notes to a status deck
Write the notes in a fixed order, in a file
Use the same headings every week, one line per item: overall status and a one-sentence headline; done this week (with figures); workstream, owner, status (Green, Amber or Red) and a short reason; risks and issues with an owner and a date; next week; decisions or help you need. Save them as a Word, .txt or .md file, or attach a spreadsheet (.xlsx or .csv) if your tracker exports one.
A file matters because of figures: when an attached file contains figures, the slide figures are limited to what the file says and a missing one is written as "TBD". Figures typed only in the request do not switch that rule on, so put them in the file.
Write the request and set the scenario and audience
Paste the prompt below with your dates filled in. Click "Next", then under "More" set the scenario to "Work report" (the AI is told a work report covers results, problems and next steps), the audience to "Executives" for a steering committee or "Teammates" for a team sync, and the tone to "Professional" or "Rigorous". Put the slide count in the request: 6, cover included.
Check the outline against the six-slide table
Choose "Quick mode" (1 credit per slide) and compare the cards with the table on this page. For the status-by-workstream card, pick the layout "Table" on the card: in quick mode a layout you pick is locked in. Delete or reorder cards. A card that states a figure your file does not contain says "Not in your materials: … It will be written as TBD".
Nothing is charged until you click "Generate presentation".
Generate, then add the RAG colours
Click "Generate presentation". The status words (Green, Amber, Red) arrive as plain text in the table. Colour them in PowerPoint after exporting (a few clicks), or ask in the editor in plain words ("colour the Red cells red and the Amber cells amber", 1 credit per request). We have not tested that request on a status table, so look at the result.
Export and send
Click "Export" and choose PowerPoint (.pptx) or PDF; exporting is free. The export panel shows "x / y figures have a source" and an option "Add a sources page at the end", which lists every figure on the slides and where it came from.
A six-slide weekly structure, and a real table slide with a flagged row
The table is our suggested structure (not a product template). Slides 3 and 4 are the ones people read, so keep them as tables.
| # | Slide | What goes on it | Layout to pick |
|---|---|---|---|
| 1 | Cover and headline | Week ending, the overall status (G, A or R) and the headline in one sentence | Cover |
| 2 | Done this week | Three to five outcomes, each with its figure | Key figures or Cards |
| 3 | Status by workstream | Workstream, Owner, Status, Reason: up to 6 rows | Table |
| 4 | Risks and issues | Risk, impact, owner, date | Table |
| 5 | Next week | Three to five planned items with owners and dates | Timeline or Steps |
| 6 | Decisions and help needed | The ask, who decides, by when | Summary / next steps |
The picture is the last slide of our recorded course proposal for a curriculum committee (Data Literacy 101, October 20, 2026, deep mode, 10 slides). It is not a status report. It shows how a six-row table comes out, and how one row that needs a decision is picked out in the accent colour with the value TBD.
Prompt (English)
Weekly status update, 6 slides
Using the attached weekly notes, make a 6-slide project status update for [the steering committee / my team], week ending [date]. Stick to the notes: don’t add outside facts or figures, and write TBD for any figure that is missing. Slides in this order: cover with the overall status in one line; done this week; status by workstream as a table with the columns Workstream, Owner, Status (write Green, Amber or Red) and Reason (under 10 words); risks and issues as a table with owner and date; next week; decisions I need, with who decides and by when.
(Fill the brackets. Write Green, Amber and Red as words so they stay editable text in the PPTX.)
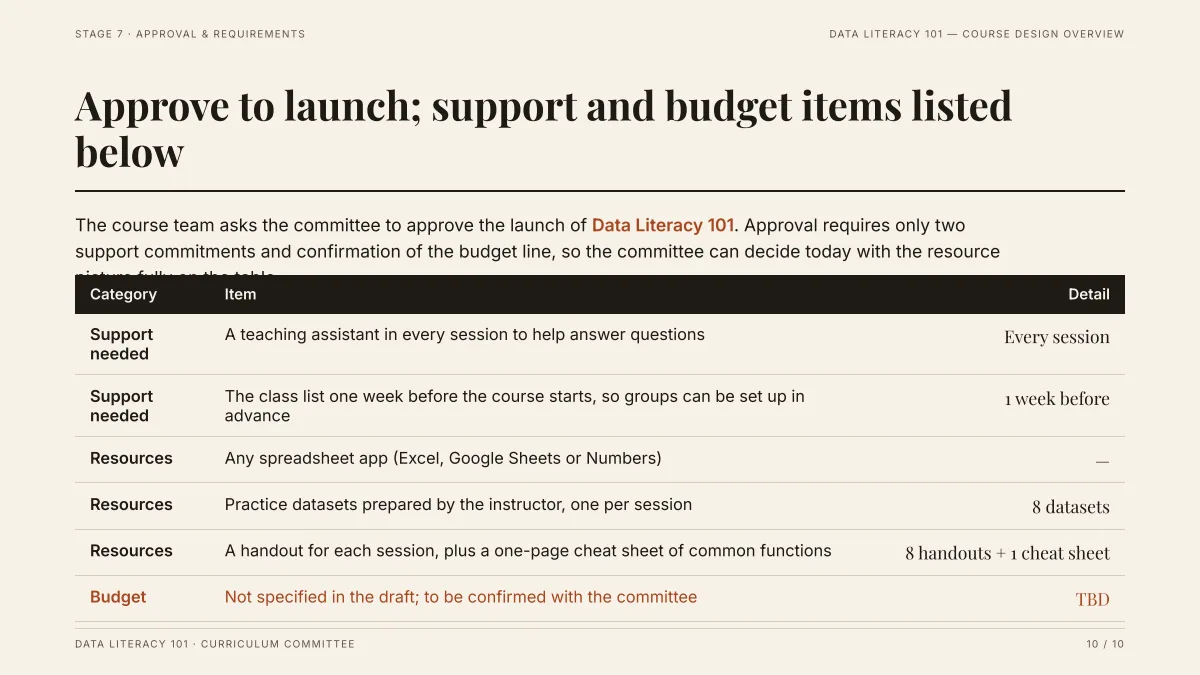
- It is a real table: a header row and six rows under three columns. In the exported PPTX it is a PowerPoint table (7 rows by 3 columns, counted in the file), not a picture, so each cell edits like any table.
- The Budget row is picked out in the accent colour and its value reads TBD, because the draft gave no budget and the request said not to add outside figures. This is the look you want for a Red row, but here the AI chose it itself: we cannot promise it will do the same for your status words.
- Look closely: the intro sentence runs into the table header. Check every table slide for text that collides before you send it.
What do red, amber and green mean in a status report?
These are common conventions, not a standard, and our summary of them; agree the thresholds with your sponsor and write them on a legend line under the table (for example "Amber = more than one week behind").
| Status | Common meaning | What to write beside it |
|---|---|---|
| Green | On track, no help needed | Nothing, or the next milestone |
| Amber | At risk: it may slip, and a recovery plan exists | The risk, the plan, the owner and the date |
| Red | Off track or blocked: it needs a decision or help | What is blocked, what you need, from whom, by when |
Can the product colour the RAG cells?
Not by itself, as far as we can see in the code (read 2026-11-07):
- In quick mode a table slide has 2 to 5 columns and up to 6 rows, and each cell is plain text of limited length. There is no colour setting per cell.
- With more than 6 workstreams, split them across two table slides ("Status by workstream, 1 of 2") or group the small ones.
- Deep mode (3 credits per slide) lets the AI design each slide freely, and in our recorded deck it picked out a row in the accent colour by itself. We have not recorded a status table in deep mode.
- In the exported PPTX a table without merged cells becomes a PowerPoint table, and cell fill colours are written into the cells. So colouring in PowerPoint works and stays editable.
How do I repeat the same structure every week?
There are two ways, and they trade figure checking against keeping your own file:
| | A. New deck from new notes | B. Change last week’s file | |
|---|---|---|
| How | Same prompt, this week’s notes attached | Add last week’s exported PPTX, choose "Change this PPT", and send "Update to the week ending [date] with the notes below; same slides, same order" |
| Cost | 1 credit per slide in quick mode (6 for six slides) | 1 credit per request |
| Figures | Checked against your file; missing ones become TBD | Not checked against sources in this mode |
| Colours | Added again each week | Kept as they were, but the AI cannot change colours, so recolour changed cells by hand |
| Best when | The structure changes, or you want the source check | The deck is settled and only the words change |
For B, the AI rewrites text in text boxes and table cells and leaves the layout, fonts and colours as they are. We have not recorded a weekly update. The recorded run for this mode (see the guide on editing a PowerPoint) changed text on all 8 slides of a deck in one request.
How many slides should a status presentation have?
Six slides for an update you present in about 6 to 12 minutes, by the rule of thumb of one to two minutes per slide (a guideline, not a standard; see the guide on slide counts). If people read it rather than hear it, four slides do: keep 1, 3, 4 and 6. The product accepts 1 to 30 slides and the cover counts.
What should I check before I send it?
- Every status word against your tracker: the AI wrote the sentence, the colour is your call.
- The week-ending date and any date in the risks table.
- Figures: search the deck for "TBD", and open the export panel to see how many figures have a source.
- Each table slide for text that runs into a header or a neighbouring row.
- Speaker notes: the exported PowerPoint has none, so add yours in PowerPoint (see the guide on speaker notes).
Questions
Can AI make a weekly status report presentation?
Yes, for the slides. Attach your weekly notes, ask for six slides in a fixed order, check the outline cards, and generate an editable PowerPoint. You still own the content: check every status, date and figure against your tracker.
How do I show RAG status in the slides?
Write Green, Amber and Red as words in a Status column of a table slide. In quick mode the product does not colour a cell for you, so add the colours in PowerPoint after export, or ask the AI to colour them and check the result.
How many slides should a project status update have?
About six: cover with the overall status, done this week, status by workstream, risks and issues, next week, and decisions needed. This is our suggested structure; use four if the update is read rather than presented.
Can I reuse last week’s deck?
Yes. Add last week’s PPTX with "Change this PPT" and ask for the new week’s changes: it is 1 credit per request and keeps your layout. The AI cannot change colours or chart data in that mode, and figures are not checked against sources.
Will the AI make up progress or numbers?
If you attach a file that contains figures, a figure it lacks is written as TBD instead of an invented number. If your figures are only typed in the request, that rule is not switched on, so check the slides. In our recorded run, a missing budget came out as TBD.
How much does it cost?
Writing the outline is free. Quick mode costs 1 credit per slide, deep mode 3, each AI edit 1, and exporting is free. New accounts get 20 free credits; credit packs are one-time purchases (for example $5.99 for 40 credits plus 10 bonus) with no subscription, and credits never expire. See the Pricing page.
Start from this week’s notes
Attach your notes, ask for the six slides above, and see which figures are marked TBD before any slide is made.
Make my status deck