How do I make a year-end review presentation with AI?
Updated 2026-11-10
Gather the year’s numbers and projects into one or two files (a spreadsheet and a Word note), attach them, say who the review is for and how many slides, and generate: you get an outline of about 10 cards to check, then an editable PowerPoint (.pptx). A year-end or annual review usually runs 8 to 12 slides: results against goals, the wins that explain them, what missed, what you learned, and next year. That length is common practice, not a rule.
The hard part is the numbers, not the layout. The AI only knows what you attach or type. When your files contain figures, the slides may use only those figures and a missing one is written as “TBD”; it does not estimate your results. Writing the outline is free and a quick-mode slide is 1 credit, so a 10-slide deck is 10 credits.
What we have and have not done: we have no recorded year-end review. The picture is a real table slide from another recording (a launch plan for a made-up coffee brand) and the example request is invented. Product limits come from the interface and code, read 2026-11-10. For a Chinese-language version, see the Simplified and Traditional Chinese guides linked below.
Five steps from the year’s data to a review deck
Put the year in two files
A spreadsheet (.xlsx or .csv) with the goals and the results by quarter, and a short Word or text note (.docx, .md or .txt) with the projects, the wins, what missed and what you learned, each with its number. A PDF of last year’s deck can go in too. Up to 24 files, 25 MB each.
Tables over 2,000 rows are summarized first, so send the summary tab rather than the raw export.
Write the request with the audience and the slide count
Click “Add files”, then write, for example: “A 10-slide year-end review of the customer success team for the VP and the leadership team. Results against the 2026 goals first, three wins, two misses with what we changed, the team’s year in numbers, and the plan for 2027. Use only the attached figures; write TBD where a number is missing.”
Under “More”, set the scenario to “Work report”, the audience to “Executives” (for a leadership review) or “Teammates” (for a team look-back), and a tone such as “Professional”. Set the “Slides” menu to 10.
Check each outline card against the 10-slide table
Click “Next”. Compare the cards with the table below. A card that needs a figure your files lack carries a note, “Not in your materials: … It will be written as TBD”. Fill the gap in a file and re-run, or take that claim out of the talk.
Generate and check the numbers
Click “Generate presentation”. The export panel shows “x / y figures have a source”: open the ones without. A figure the AI calculated from yours (a percentage change, a total) is yours to verify; we have not tested how it handles derived numbers. You can switch on “Add a sources page at the end” if the review needs one.
Export, then add the story only you know
Export PowerPoint (.pptx) or PDF. Exporting costs no credits, but it needs Level 2 (any credit pack, bought once) or one new person invited per deck. Tables stay native PowerPoint tables and text stays in text boxes. There are no speaker notes in the export, so write your talking points in PowerPoint.
A 10-slide year-end review, slide by slide
This is our suggested structure (common practice, not a standard). The last column is the slide type the outline would normally suggest; the AI may choose another, and in quick mode you can lock a layout on any card.
| # | Slide | What goes on it | Layout |
|---|---|---|---|
| 1 | Cover | Team or name, the year, the audience and the date | Cover |
| 2 | The year in one sentence | The headline result against the goal | Statement |
| 3 | Results against goals | Each goal, the target, the actual, the gap | Table |
| 4 | Key numbers | Two to four figures that carry the year | Key figures |
| 5 | Three wins | What was done, by whom, the result | Cards |
| 6 | What did not work | Two misses, the cause, what changed | Comparison |
| 7 | Timeline of the year | Launches, hires, incidents in order | Timeline |
| 8 | What we learned | Three lessons, each tied to a slide above | Points + takeaway |
| 9 | Next year’s plan | Goals and the first three steps | Steps |
| 10 | Asks and thanks | What you need to decide or provide, and who helped | Summary / next steps |
Slides 2 to 4 are the results; 5 to 8 explain them; 9 and 10 look ahead. For a 5-slide version keep 1, 3, 5, 6 and 9.
The picture is a real table slide from our recorded launch plan (slide 11 of 12): four metrics with a target, a weekly pace and how each is tracked. It is the shape of slide 3, but its content is a coffee launch, not a review.
Prompt (English)
Year-end review, 10 slides
Attached: goals-and-results.xlsx and year-notes.docx. Make a 10-slide year-end review of the customer success team for the VP and leadership team. Order: cover, the year in one sentence, results against goals, key numbers, three wins, what did not work, timeline of the year, what we learned, plan for 2027, asks. Use only the attached figures; write TBD where a number is missing. Each slide title states the point.
(Made-up files and team. Replace the order and the audience with yours.)
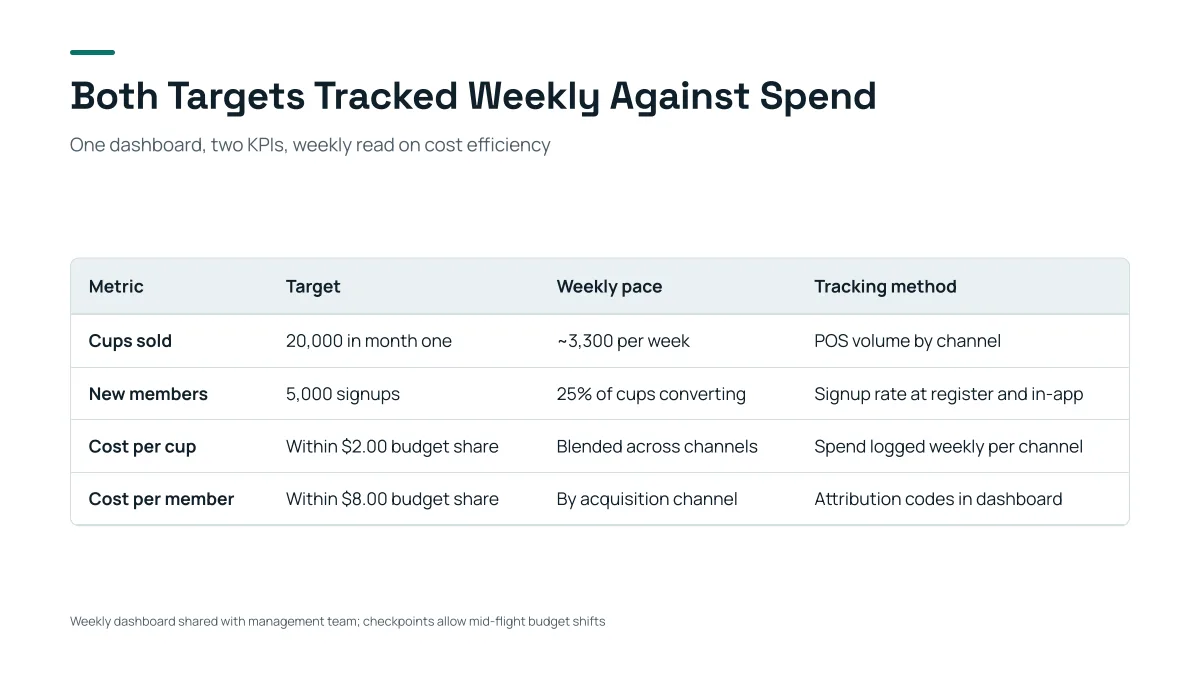
- Four rows and four columns, each cell a few words: this is the size that stays readable. A results table with ten goals should be split across two slides.
- The table is a native table in the exported PowerPoint, so you can edit a number in PowerPoint.
- It is a launch plan for a made-up brand. None of its content applies to a review.
- Replay this run step by step (no sign-in)
- Download the PPTX
- Business review decks: results against targets
- OKR presentations: objectives, key results and a score
- Status reports and project updates
- Retrospective slides: what went well and what to change
- Strategy presentations: priorities for next year
- 简体中文版:年终总结 PPT
- 繁體中文版:年終報告簡報
How is a personal, team and company year-end review different?
The structure above holds for all three; what changes is the audience, the evidence and how much is about you. These are our suggestions.
| Personal review | Team review | Company review | |
|---|---|---|---|
| Audience | Your manager, or a promotion panel | Your team, the VP or peers | Everyone at an all-hands, the board or investors |
| Core question | Did I deliver what was expected, and what did I grow into? | What did we deliver together, and how do we work better? | Did we hit the plan, and where are we going? |
| Evidence | Goals met, projects with results, feedback you received | Team goals against actuals, shipped work, incidents | Financial and operating results, customers, headcount |
| Typical length | 5 to 8 slides | 8 to 12 slides | 12 to 20 slides |
| Layouts that fit | Cards for wins, Table for goals | Table, Key figures, Timeline | Key figures, Table, Comparison |
| Watch out for | Claiming team results as yours without saying who else did the work | Naming individuals for misses | Numbers that contradict the audited report |
In a company review, the figures should come from the finance or operations report you attach. Do not type them from memory.
Where should the numbers come from?
From the source you would defend in the meeting: the finance report, the dashboard export, the goal tracker. Export it to a spreadsheet and attach it. The product then reads each cell with its sheet and place, and traces every figure on a slide back to it.
| What you give it | What happens to the numbers |
|---|---|
| An attached spreadsheet, Word, PDF or slide file with figures | The deck is in strict mode: figures on slides may only come from those files; each is traced to its place in the file |
| A figure the files do not have | Written as “TBD” on the slide, with a note on the outline card |
| Figures typed only in your request | Used, but they do not switch strict mode on by themselves |
| Figures from a web search at the outline step | Shown with a source, but not treated as your data |
Before export, the panel counts “x / y figures have a source”, and you can add a sources page at the end. That is the product’s check that a number matches a file; it does not check that the file itself is right.
What can AI not do for a year-end review?
- It does not know what happened. It cannot see your calendar, goal tracker, HR system, CRM or Jira (no such integrations), so every result has to be in a file or the request.
- It does not judge your performance or rating, and it cannot tell which win matters most to your manager.
- It does not supply the honest reason a goal was missed. If the note says “market conditions”, the slide will say so.
- It does not protect confidential data. The text of your files is sent to AI providers to write the deck; leave out what must not leave your company.
- It may not calculate derived numbers the way you do. Percentage change, year over year and averages are yours to check.
- It does not write speaker notes into the PowerPoint, and it does not replace the story you tell when presenting.
How do I write the “what did not work” slide?
Name the miss with its number, the cause you know, and what changed, in that order, on one slide with two rows. Common practice is to separate facts from blame: “Renewal rate was 81% against an 88% goal because two large accounts left; we added a quarterly check-in for the top 20” reads better than “we were unlucky”. Tell the AI the cause in your note; it will not invent one.
Can I reuse last year’s deck?
Yes. Attach last year’s .pptx or PDF with this year’s numbers file and say “keep the structure of the attached deck; update every figure from the new spreadsheet”. The AI rewrites the deck as new slides from your files rather than editing the old file in place. To change one slide of an existing PowerPoint without rebuilding it, see the guide on editing a PowerPoint with AI.
Questions
How many slides should a year-end review have?
Common practice is 5 to 8 for a personal review, 8 to 12 for a team review and 12 to 20 for a company review. The product accepts 3 to 30 slides from the menu or any count you write up to 30.
What should a year-end review presentation include?
Results against goals, the key numbers, the wins, what did not work and what changed, what you learned, next year’s plan and what you need from the audience. The 10-slide table above gives each one a slide.
Can AI write my annual review slides from my performance data?
It can build the slides from the files you attach, using only their figures, and mark missing ones “TBD”. It cannot access your systems, so export the data first, and check every number before you present.
What is the difference between a year-end review and a retrospective?
A year-end review reports results against goals for the audience that funds or manages the work. A retrospective is the team’s own look at how it worked, to decide what to change. They share the lessons slide; see the retrospective guide.
Is there a Chinese version of this guide?
Yes: 简体中文 and 繁體中文 versions are linked on this page. They are written for how people in those languages search and are not translations of this one.
Can I make the deck in another language?
Yes. The “Language” menu next to the box offers Auto, Simplified and Traditional Chinese, English, Japanese, Arabic, Persian and Russian; Auto follows the language of your request.
How much does it cost?
Writing the outline is free. Quick mode costs 1 credit per slide, deep mode 3, each AI edit 1. Exporting costs no credits, but it needs Level 2 (any credit pack, bought once) or one new person invited per deck. New accounts get 20 free credits; credit packs are one-time purchases with no subscription, and credits never expire. See the Pricing page for the packs.
Are my files used to train AI models?
No. We do not use your files to train AI models. The text of your files is sent to AI providers to write the outline and slides; the Privacy Policy has the details.
Start your year-end review from your own numbers
Attach the spreadsheet and the notes, set the audience and slide count, and read the outline before any slide is made. The outline is free.
Make my year-end review